January 2025 update: La Niña is here
La Niña conditions emerged in the tropical Pacific in December. There’s a 59% chance La Niña will persist through February–April, followed by a 60% chance of neutral conditions in March–May. Read on for the recent observations that led us to declare the (long-awaited) onset of La Niña and lots of details for current and potential upcoming conditions.
Just the facts, ma’am
A quick briefing, if you’re just joining us—La Niña is one phase of the El Niño/Southern Oscillation (ENSO), a pattern of sea surface temperature and atmospheric changes in the tropical Pacific Ocean. La Niña’s signature is cooler-than-average surface water in the east-central Equatorial Pacific, while its counterpart, El Niño, features warmer-than-average surface water. The atmospheric circulation over the tropical Pacific, called the Walker circulation, exhibits characteristic changes during La Niña and El Niño, so we call ENSO a “coupled” ocean-atmosphere system. ENSO is a seasonal phenomenon, meaning it lasts for several months in a row. The atmospheric changes of ENSO are communicated all around the world, changing temperature and rain/snow patterns in known ways.
Time to get down to brass tacks
Ok! We’ve been expecting La Niña to show up since last spring. While she’s dragged her heels, all the pieces came together this past month.
The tropical Pacific sea surface temperature loitered in ENSO-neutral since April 2024, with our primary ENSO monitoring index, the Niño-3.4 index, within 0.5 °C of the long-term average. In December, however, the Niño-3.4 index was -0.6 °C, according to the ERSSTv5, our most reliable long-term sea surface temperature dataset.

2-year history of sea surface temperatures in the Niño-3.4 region of the tropical Pacific for all La Nina events since 1950 (gray lines) and the recent (2024-25) event (purple line). After staying in neutral for most of 2024, the Niño-3.4 index passed the La Niña threshold in December 2024. Graph by Emily Becker based on monthly Niño-3.4 index data from CPC using ERSSTv5.
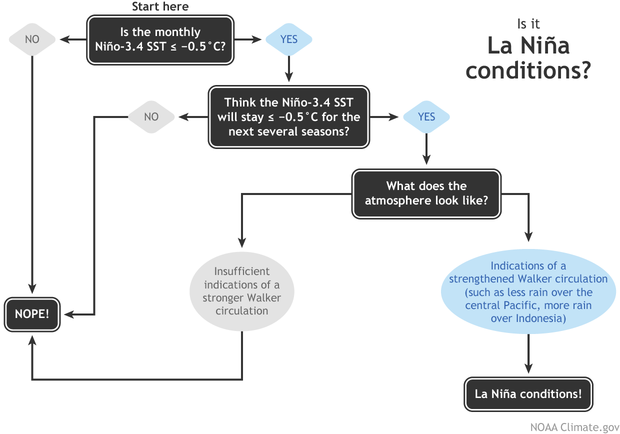
With the Niño-3.4 Index exceeding the La Niña threshold of -0.5 °C, we can move on to the second box on our flowchart—do we think the Niño-3.4 index is going to stay in La Niña territory for the next several seasons? (“Seasons” here means any 3-month-average period.) The consensus among our computer climate models is yes. Also, there is a substantial amount of cooler-than-average water under the surface of the tropical Pacific, which will provide a source for the surface over the next few months.
So, we’re on to the third box, which has actually been checked for a while now (more on that later). The atmosphere has been looking La Niña-ish for months, with stronger-than-average trade winds, more clouds and rain over Indonesia, and drier conditions over the central Pacific—all hallmarks of an amped-up Walker circulation. In December, the Equatorial Southern Oscillation Index (EQSOI), which measures the difference in surface pressure between the western and eastern Pacific, was 1.5 (positive values indicate a stronger Walker circulation). In fact, this is the 5th-strongest December EQSOI in the historical record. Drumroll… La Niña conditions have developed.

This animation shows weekly sea surface temperatures in the Pacific Ocean compared to average from October 14 2024–January 5 2025. Orange and red areas were warmer than average; blue areas were cooler than average. The sea surface temperature in the key ENSO-monitoring region of the tropical Pacific (outlined with black box) was slightly below average for many weeks, but the cooler-than-average region has strengthened lately. NOAA Climate.gov animation, based on Coral Reef Watch Data and maps from NOAA View. View the full-size version in its own browser window.
Break it down for me
There are a lot of different tidbits I want to tell you about this month, so let’s go Q&A-style.
How long will La Niña last?
There’s a reason our flowchart says “the next several seasons” instead of providing a specific number: we can make predictions, but it’s impossible to know ahead of time exactly how long La Niña conditions will last. To be categorized as a La Niña event in our historical record, the three-month-average Niño-3.4 Index (the Oceanic Niño Index) needs to stay at least 0.5 °C below average for at least five consecutive, overlapping seasons. Current odds are 60% that the March–May Oceanic Niño Index will be neutral, which would make this event last fewer than five. That’s not to say it’s impossible for this La Niña to last longer, of course—nature is always full of surprises! There is a ~40% chance for La Niña to persist into March-May 2025.
How strong will La Niña be?
It’s very likely this La Niña will be weak, with the Niño-3.4 index unlikely to reach -1.0 °C for a season. This is based on computer model guidance and how late in the year La Niña conditions emerged. ENSO events peak in the northern Hemisphere winter, and there’s just not a lot of time for La Niña to strengthen.
Can La Niña still affect our winter climate?
Sure can, although a weak La Niña tends to have a weaker influence over temperature and precipitation patterns.
Why was La Niña so slow to develop?
The short answer to this is “we don’t yet know.” The emergence of La Niña-like atmospheric conditions before substantial tropical Pacific Ocean surface cooling was unusual, though. The global oceans have been running much, much warmer than average for more than a year, which might have had a hand in La Niña’s delay. When we calculate the Niño-3.4 index but account for the temperature of the tropical oceans (the “Relative Niño-3.4 index”) we get an index that’s been in La Niña territory for months. Only this past year or so has the difference between the traditional and relative Niño-3.4 indexes been so large, and we’re still researching this new measurement and all the implications for ENSO development and impacts in a warmer world.
Has La Niña had any impact on temperature and rain patterns yet?
La Niña affects global climate primarily through atmospheric changes, and since the tropical atmosphere has been looking like La Niña for a while, this is a reasonable question! The global climate is incredibly complicated, and even a big factor like ENSO is only one player. Other climate patterns, climate change trends, and random variability can have a strong influence on overall seasonal patterns. That said, it’s interesting that the October–December 2024 temperature and rain/snow patterns over the U.S. resemble the expected patterns from previous La Niña events. See the October–December La Nina temperature and rain/snow maps, and here’s the general page if you would like to poke around.

Map showing the difference from average precipitation during October–December 2024. Green areas received more rain and snow than the 1991–2020 average, while brown areas received less. The pattern here resembles what we would expect in October–December during La Niña. Map by climate.gov from CPC data.
Temperature has a strong influence from climate trends, and the October–December 2024 temperature pattern over the U.S. is clearly dominated by more warmth.

Map showing the difference from average temperature during October–December 2024. Orange areas were warmer than the 1991–2020 average. The pattern here resembles what we would expect in October–December from combined climate trends and La Nina. Map by climate.gov from CPC data.
You’re running out of column inches. Any last tidbits?
Thanks for asking! Speaking of La Niña impacts, you might recall there’s a link between La Niña and active Atlantic hurricane seasons. In brief, La Niña reduces vertical wind shear—the difference between near-surface winds and upper-level winds—and makes it easier for hurricanes to grow. Interestingly, the August–October 2024 wind shear in the Atlantic Main Development Region (an area of the Atlantic where hurricanes tend to develop) was the weakest since 1950 (h/t NOAA’s Matt Rosencrans). We can’t say how much of it was related to La Niña, but given the relative Niño-3.4 index has been in La Niña territory for a while now, it’s an interesting situation that bears more research.
The bottom line
As this unusual La Niña progresses, we’ll be here to keep you updated on all things ENSO!
Comments
Heating source in Pacific Ocean
I have published these papers:1) Further FGGE Forecasts for Amazon Basin Rainfall the authors are Julio Buchmann, Jan Paegle, Lawrence Buja and Robert E. Dickinson at Monthly Weather Review in 1989 2) The Dynamical Basis of Regional Motion Fields Sourrounding Located Tropical Heating the authors are Julio Buchmann, Lawrence E. Buja, Julia Nogues-Paegle and Jan Paegle at the Journal of Climate in 1995.
La Nina
Unfortunately for California and the brutal wildfires we are experiencing, La does look like it has affected our winter pattern and January precipitation looks bleak right now. I am already starting to think about ENSO next year. Too long a lead time with the models for any reliance. But if we went with the CFSv2 at this time we are looking at ENSO neutral year next year. I can't remember the last time we've had one of those and haven't had many over the last decade. Just think about the contributors here for once talking about how much ENSO is not going to factor into weather.
It has been a while, for…
It has been a while, for sure. 2019–2020 was a neutral winter, but that's the only one we've had since the ENSO Blog started in 2014!
Very well written, thanks!!
Very well written, thanks!!
Date error
Fixed! Thanks.
Fixed! Thanks.
La Niña Modoki
The ONI is not over 0.5. I believe this is more a La Niña Modoki. I don’t expect to have cooling right off the coast of South America. We have a fast warming with 26C isotherm around 10-15m depth.
You're right, the most…
You're right, the most recent ONI, October–December, is only -0.4 C. We think it's very likely that the November–January ONI will pass the La Nina threshold.
NOTHING resembles any Nina…
NOTHING resembles any Nina. 100% of the tropical countries are smashing all heat records set during 2023/2024, 100% ! including all oceania and south america and including Ecuador coast (GUayaquil dec 2024 much warmer than dec 2023 and all records smashed over and over again) and all central america, the EXACT opposite of what we would expect ina Nina or even a transition.
You fail to understand teh causes because you clearly don't have an idea on what it's been going on with the current drop of the low clouds in the tropics and the reduction of the albedo. Climatology is NOT for you. Leave it to the REAL EXPERTS and not politicians who pretends to understand it.
I think the tropics are…
I think the tropics are surely going to be warmer than climatology due to global warming. For La Niña, I think what matters is whether the eastern equatorial Pacific is relatively colder than the rest of the tropical oceans.
Experts
1. For what it's worth, the people who write this blog are some of the world's foremost experts on ENSO. And, every time one of them writes a post, they make it very clear just how knowledgeable they are about this.
2. Unlike politicians, who regularly speak in terms of certainties (and who will sometimes even double down when they are wrong, or who will insist that the experts are wrong and that they are right), the people who write these blog posts readily acknowledge what they don't know, while saying what they need more information on and what they are currently researching.
3. You made some assertions in your post, including how large parts of Latin America are setting heat records, a drop In low clouds in the tropics, and a reduction in albedo. So, what evidence backs them up? And, what other explanations (aside from the current state of ENSO) are possible for the phenomena you described?
No Snow
Worst Winter for Snow that we have seen in Years for Arizona , speaking as President of Northern AZ Snowmobile Club...... Last year was awesome and has been for a number of years now.... Especially the White Mountains of AZ...... This year awful... NOTHING since the PNA was Neg in Nov 2024
I hear you
I understand where you're coming from. As this blog post points out, Arizona snowfall tends to suffer during La Nina. Interestingly, the PNA index has been mainly positive since the start of December, which is not typical of La Nina, but obviously that hasn't helped with the rain and snow over the southwestern U.S.
West Pacific region
What does this mean for likely Cyclone formation in the western Pacific? Does it lower the chances of them forming and curtail their potential strength?
Asking as we are sail towards the Solomans...
Thanks Si
El Nina
Here in Louisiana we have what we call wicked weather...as far as El Nina in certain parts we only getting rain no freezing.just cold which I love but messy muddy and rainy so for us here we do not get much winter or snow maybe way up by Shreveport but around winnsboro not so much 9 x out of 10
La niña
I always thought that a La Niña winter meant a lot of snow for Idaho and Montana. So far, it is missing us here in Hamilton MT. I'm not sure what is going on, but it's confusing.
La Nina
There is a term the experts use here call variability. That means that the expected impacts from La Nina are not going to occur 100% of the time. La Nina increases the odds of certain impacts but there are times the opposite happens. La Ninas usually result in dry years in California but every once in awhile result in a wet year. This is also a weaker rather than stronger event which means there is more uncertainty
Thanks, Bob!
Thanks, Bob!
Thank you Nathaniel For all…
Thank you Nathaniel
For all the knowledge you and all the experts have brought to the blog and for answering all of our questions.
ENSO Neutral Conditions Persist
The Oni index at https://origin.cpc.ncep.noaa.gov/products/analysis_monitoring/ensostuff… shows OND 2024 at -0.4°C.
Yes currently ENSO Neutral Conditions Persist - Earliest Potential First La Niña Thresh Hold Expected January end.
Hope NOAA has not changed the criteria for La Nina !
Relative Nina
I like that you all are researching the Relative Nina. It must be something like looking for a moving target inside another moving target. A La Nina "Event" being different than a qualified, so to speak, "Historically Recorded Event". Do you look back and adjust your measurement requirements versus the correlated coupling of atmosphere during non-qualified events? As looking back is always difficult for reducing biases, have you developed any real world predictive tests other than computer models? That sounds like a near impossibility to me but I never know.
Until recently (just the…
Until recently (just the past year), the traditional Nino-3.4 and the relative Nino-3.4 were nearly the same. Last month, I showed some figures comparing the atmospheric coupling in previous observed events, but it would be interesting to examine the atmospheric response to the relative Nino using initialized coupled models like the NMME.
Has This Ever Happened Before?
I am just curious to know whether if there were situations where a La Niña Advisory was declared before, but not enough for a sufficient duration to officially be a La Niña? The same could be said for El Niño and an El Niño Advisory declaration as well. If it hasn't happened before, could this be a first?
It's my understanding that the Australian counterpart has not officially called a La Niña even though most of the typical indicators have been met (needs to be -0.8°C in the Niño3.4 SST for at least 3 months to become established).
I'm sure we've never been in…
I'm sure we've never been in the same situation, because nature is infinitely variable! However, the La Nina of 2016-17 was pretty borderline when we declared it: https://www.climate.gov/news-features/blogs/enso/november-2016-la-ni%C3…;
Relative Niño
It sounds like you are studying this new Relative Niño index, to see how accurate it is compared to the current measures you use. Whenever you get some answers, would you include them in one of your blog posts?
Thanks for your interest! …
Thanks for your interest! We will definitely update our ENSO blog readers on any insights provided by relative SSTs.
Solar Storms?
What can we expect this year in the tropical Atlantic? Did I really read right yesterday about a Nina effect moving toward Puerto Rico?
Gracia
Will this be considered as a La Nina event in the records?
Hello there,
Thank you for the informative piece - I have learnt alot more on how periods can be classified into La Nina events, especially with the useful flowchart which helps us in understanding the train of though in classificaiton.
Could I just check, given that we have classified the current period as La Nina, will it eventually be shown on the following CPC website: https://origin.cpc.ncep.noaa.gov/products/analysis_monitoring/ensostuff… that is a La Nina event?
According the methodology, "By historical standards, to be classified as a full-fledged El Niño or La Niña episode, these thresholds must be exceeded for a period of at least 5 consecutive overlapping 3-month seasons." Therefore, will this event be reflected as a La Nina event eventually in the historical records, if we move into an ENSO-neutral before we see 5 consecutive overlapping 3-month seasons?
Thank you once again!
That's a good question, Adam…
That's a good question, Adam. Given how late this event unfolded, it raises some doubt that we will reach the 5-season threshold. We will have to see, but if it doesn't reach 5 (say, if only NDJ through FMA are below -0.5C), then it will not show up as an event on the CPC website.
It's also worth mentioning that event classification can change when the climatology base periods get updated every 5 years. Currently we use the 1991-2020 base period to define ONI, but soon that will change to 1996-2025, and so some of the recent ONI values will shift slightly. Sometimes those slight shifts can move an event in or out of the 5-season threshold.
1996-2025 period revision of Nino SSTs
Yes, indeed there is a possibility of some of the seasonal ONIs could be revised towards La Nina thresh hold, due to increase in the overall SST for 1996-2025.
That's right... we have to…
That's right... we have to remember the last 10 years of ONI values in this table will be revised based on future (not yet known) data. One nice attribute of the relative SST index is that it doesn't depend on the chosen climatology (we just pick one climatology).
Cold weather
I don't know if this is the result of the 'La Nina' but I live south of Pittsburgh, PA and this is the first year since 2015 that we have really had a winter. I have one coat I call a 'snow coat' which I seldom wear, but I use it constantly now and my wonderful snow boots, which I almost tucked away for good, are a daily aid in getting me to my car and through the snowy yard. Although the snow is almost a rain/snow and, as yet, no large accumulation, it is quite a different winter than the last nine. I hope this isn't a trend. I was enjoying the more temperate winters.
I hear you
I understand where you're coming from, Anita. I'm in central New Jersey, which is a bit milder than interior Pennsylvania on average, but I do not remember any particularly cold winters since 2014/15 (especially February 2015). So, this has been the coldest start to winter for this part of the country in recent memory. I would hesitate to blame La Nina, however, as we generally do not see such a La Nina temperature influence in this part of the country. It will be interesting to see how long this colder pattern persists and to diagnose the causes afterward, if it does.
La Niña is acting like El Niño
I am so angry that La Niña supposed to be cold and snow instead I had a w arm December La Niña is acting like El Niño which is not ok . El Niño is mean I rather have super La Niña. I thought super La Niña is better for snow than weak La Niña
La nina effect
We love la nina here in Zimbabwe and southern Africa. This brings our summer rains roughly Nov to March-April. Dreadful drought last 2 years or do due to the el nino which persisted. LONG LIVE LA NINA!!!
La Nina
As a SO-CAL resident for 71 years I distinctly remember the La Niña of 1976/77. It was followed by El Niños for both 78/79?
You might mean 1975/76 which…
You might mean 1975/76 which was followed by two weak El Nino winters: https://origin.cpc.ncep.noaa.gov/products/analysis_monitoring/ensostuff/ONI_v5.php
Hottest January Ever?
Will this January be the hottest January ever record globally or will it warm enough to enter the top 5.
The data will be in soon!
The data will be in soon!
Ireland/Europe
Does the La Nina affect weather in the North Atlantic and countries like Ireland and France?
Thank you
It's a good question and the…
It's a good question and the short answer is that El Nino/La Nina does not impact Northwest Europe as much as it does in other locations. Any possible connections tends to be through the stratospheric polar vortex. More on this from Amy Butler: https://www.climate.gov/news-features/blogs/enso/el-niño-and-stratospheric-polar-vortex. Also check out the new-ish climate.gov polar vortex blog which will keep you updated on all things polar vortex!
Micro-climate La Nina
Thinking about the city of angles. While not officially a La Nina it sure looks like and burns like a La Nina in LA County. There was no winter rain to speak of and the Santa Ana Winds picked up like it was late October. I understand that this does not meet the five season rubric but it really does look like everything typical of a La Nina driven fire season. There is something of a back-lash or whiplash with the very wet El Ninos being followed a more typical La Nina drought. Could this be something novel (at least to me) of a specific microclimate causing "variability?" I also wonder about the upcoming Hurricane season. I understand that this a very chaotic system and most if not all bets are off. Maybe, sort of, perhaps a more vigorous Hurricane season. More info later when the cracked crystal ball gives up more data??
Cracked crystal ball is spot…
Cracked crystal ball is spot on... I always say climate prediction is like looking through a cloudy crystal ball, but yours is pretty good! So I don't know about micro-climate-- the patterns we discuss on this blog are usually very large scale, but there is a lot of research and applications that works to downscale the large scale to localities. With that said, I can report, yes, the drier conditions experienced so far in southern CA are quite consistent with La Nina (our most recent blog post discusses the typical pattern). We're betting Nov-Jan season will hit our official La Nina threshold of -0.5C or less (will receive that value next week). However, we are noticing that if we use a relative ENSO index (here) we probably would have declared this La Nina sooner. This is a new index and it's something we are reviewing for the future. Also, to your point about "whip lash" it is not uncommon for La Nina events to follow big El Nino events like we had in 2023-24 winter. In fact we expected it to be stronger and form earlier, but that clearly didn't happen. So there is probably some percent variability of wet-to-dry described by ENSO in this situation. But obviously fire weather is quite complex, a stew of different factors are involved, some local factors, and much more (than just ENSO) had to happen in order for these major fires to emerge.
Add new comment