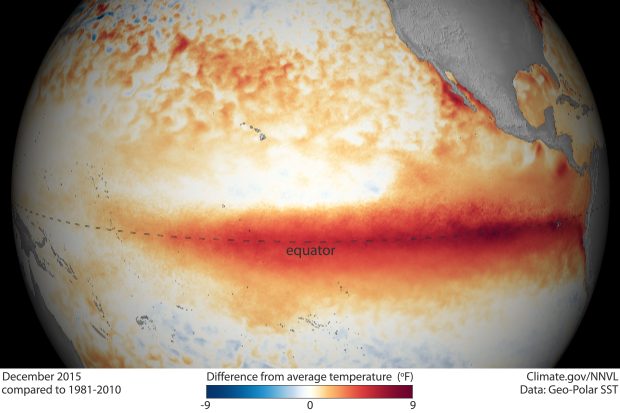
Warmth in the tropical Pacific in December 2015
Details
A strong El Niño continued during December 2015 with well above average sea surface temperatures across the central and eastern equatorial Pacific Ocean, according to NOAA Climate Prediction Center’s monthly El Niño advisory update.
This image shows satellite sea surface temperature departure for the month of December 2015. Colors show where average monthly sea surface temperature was above or below its 1981-2010 average. Blue areas experienced cooler-than-usual sea surface temperatures while areas shown in red were warmer than usual. The darker the color, the larger the difference from the long-term average.
Warmer-than-average sea surface temperatures in the eastern tropical Pacific are one of the indicators of El Niño: the warm phase of a major climate pattern called “ENSO,” which is short for El Niño Southern Oscillation.
The unusual warmth is coupled with a slowdown of the easterly trade winds, increased rainfall in the central tropical Pacific, and a drop in surface air pressure there. These disruptions to the normal air movements in the tropics affect the mid-latitude jet streams, which is how El Niño can affect the weather in the United States and other parts of the world.
This high-resolution map is based on a dataset that combines in situ measurements with near-real-time satellite observations. A map like this one provides a detailed, up-to-date view of what oceans look like at any point in time, which is helpful for monitoring how an event is evolving and for providing starting data to (scientists say initialize) forecast models. These data are not, however, the best choice for producing historical rankings of event strength because satellite data from different eras can have subtle differences that are hard to account for. Instead, scientists use carefully pieced together historical data sets.
Using the historically consistent ERSSTv4 dataset, scientists determined that the Niño3.4 index, which compares ocean surface temperatures in the east-central Pacific to the long-term average, broke the record in December, coming in at 2.37°C above average, surpassing December 1997’s 2.23°C. Since El Niño is ultimately measured on seasonal timescales, it is also worth noting that from October–December 2015, the Oceanic Niño Index was 2.25°C, essentially tied with the same period in 1997.
Forecasters expect the sea surface temperature anomalies in the tropical Pacific to decrease gradually over the next several months, and they forecast a transition to neutral conditions by the late spring or early summer. For more on how this El Niño impacted weather around the world in December 2015, read our monthly update on the Climate.gov ENSO blog.
