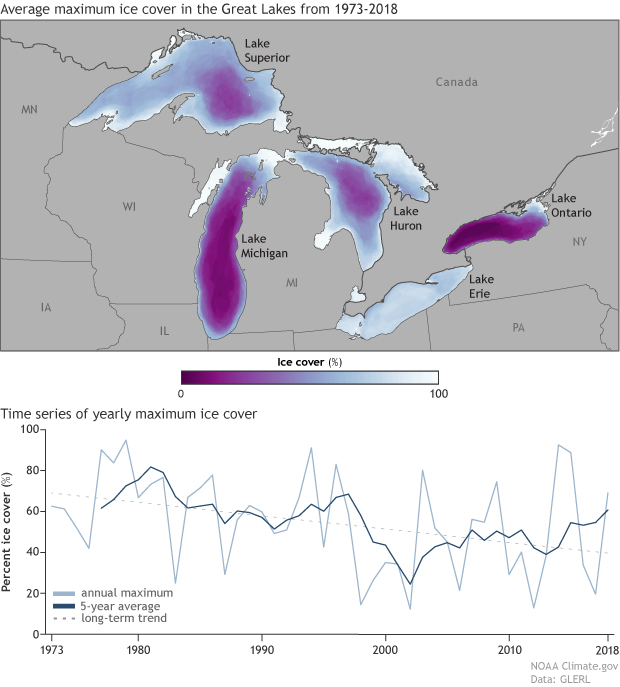
Great Lakes ice cover decreasing over last 40 years
Details
A downward trend since the 1970s in the annual maximum extent of Great Lakes ice cover, which reaches a maximum every year during late winter and early spring, spells trouble for the Great Lakes ecosystem and the people who rely on it.
The image on top shows the Great Lakes at the time of maximum ice cover averaged from 1973-2018 based on winter season data from NOAA’s Great Lakes Environmental Research Laboratory. Even at winter maximum, most lakes normally remain at least somewhat un-iced. In particular, the middles of Lakes Ontario and Lake Michigan remain on average 80-90% ice-free at winter maximum. In contrast, Lake Erie, a shallower lake, is normally over 70% ice covered by late winter.
On the bottom is a time series of the annual maximum ice cover averaged over all of the Great Lakes from 1973 to 2018. Along with the yearly data (in light blue), a five-year running average (dark blue) is also included as well as the overall trend of the maximum ice cover data (dotted line). Looking year to year, things can swing wildly from a lot of ice to a little which is why forecasting ice cover in the Great Lakes every year is so important. However, while the yearly (and even the five-year running average) can be different from year to year (or decade to decade), the trend in ice cover over all of the lakes since 1973 is downward.
The seasonal evolution of ice cover on all of the Great Lakes follows a relatively consistent schedule. All of the lakes begin to see ice develop along the shallower coasts during late fall and early winter before ice begins to expand in coverage from north to south across the Lakes throughout the winter. The Great Lakes farther south (Erie and Ontario) see their maximum ice extent in February while the maximum ice extent is normally found in March in the northern Great Lakes (Superior and Huron). By April, the lakes begin their annual melt.
Despite this fairly consistent seasonal pattern, some lakes are losing ice cover faster than others. The greatest declines have been in Lake Superior, Huron, St. Clair, and Erie. The decreasing maximum ice extent of Great Lakes ice is due to a combination of natural climate influences as well as influences from man-made climate change.
Teasing out how much of the trend is due to each influence is challenging, however. Buried within that long-term decreasing trend in lake ice are cycles of lower and higher amounts of lake ice that take place over decades. And buried within those cycles are large year-to-year swings. This variability occurs due to the randomness of the weather, but also larger climate patterns like the El Niño Southern Oscillation (ENSO), North Atlantic Oscillation (NAO), Atlantic Multi-decadal Oscillation (AMO) and the Pacific Decadal Oscillation (PDO).
Regardless of what may be causing it, you might be thinking why do we even care about ice loss on the Great Lakes? For one, shipping across the Great Lakes is a multi-billion dollar industry which employs tens of thousands of people. Every year freighters get stuck in the ice delaying deliveries and costing money. But ice cover also impacts the Great Lakes ecosystem and climate. Less ice on the Great Lakes means more open water and moisture that can be picked up and turned into lake effect precipitation for downwind communities. It also means that more water evaporates from the surface of the lakes leading to lower lake levels.
Meanwhile, many different ecosystems also rely on ice cover during the winter. Whitefish, for instance, use the ice cover to protect its eggs from big winter storms, which rile up the water. Making matters worse, if ice loss continues, cold-water fish like the whitefish might have to now compete with warm-water fish for the same resources.
These far-reaching impacts emphasize the need for continued monitoring and modeling of the Great Lakes as our climate continues to change.
