File name: GreatLakesIce_long-term_trend_620.jpg
Original Resolution: 620 × 687
File Size: 139 KB (MIME Type: image/jpeg)
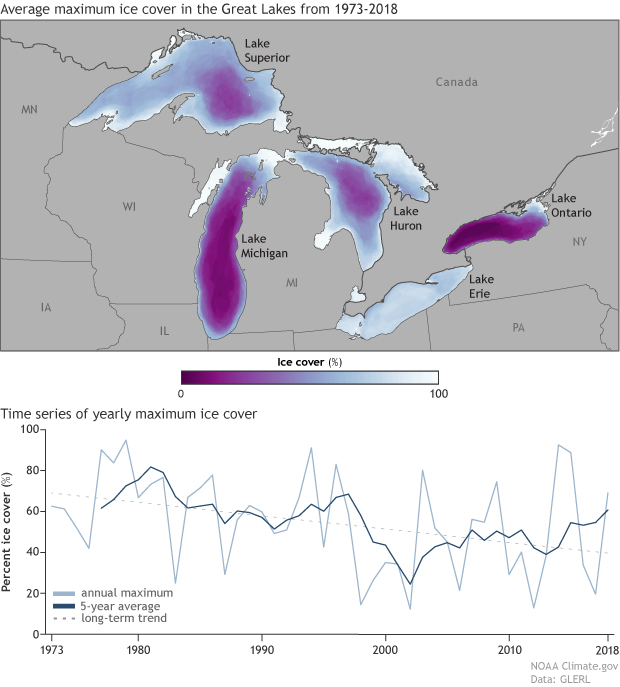
Ice cover over the Great Lakes is shown here using ice chart data from NOAA's Great Lakes Environmental Research Laboratory. (top) The maximum ice cover extent over the Great Lakes averaged from 1973-2018. Purple colors reflect less ice cover, while gray colors represent more. Even at winter maximum, most lakes normally remain at least somewhat un-iced. (bottom) A time series of the annual maximum ice cover averaged over all of the Great Lakes from 1973 to 2018. Yearly data is in light blue, while a five-year-running average is in dark blue. The overall downward trend in the annual maximum ice cover extent is shown as a dotted line. NOAA Climate.gov image using data from NOAA's Great Lakes Environmental Research Laboratory.