United States El Niño Impacts
By this point, most of you have heard that it looks like El Niño is coming, and maybe you’re wondering why you should care. After all, why should it matter if the tropical Pacific Ocean becomes warmer than average? That’s thousands of miles away from the continental United States. Well, it turns out that El Niño often results in changes in the patterns of precipitation and temperature across many parts of the globe, including North America (Ropelewski and Halpert 1987, Halpert and Ropelewski 1992).
Many folks probably remember the heavy rainfall, flooding, and landslides that occurred in California in 1982/83 and again in 1997/98. As the region suffers through a devastating drought, it could be something of a relief if we knew for certain that El Niño would bring similar soaking rains. But those two events were the 2 strongest El Niños in the past 60 years, and we’ve seen many other El Niño years where California didn’t experience those types of devastating impacts. So assuming El Niño develops, what can we expect across the United States and when can we expect it?
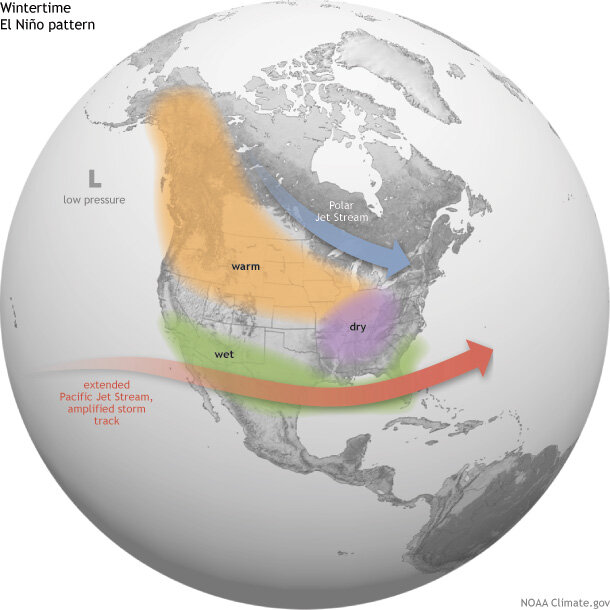
By examining seasonal climate conditions in previous El Niño years, scientists have identified a set of typical impacts associated with the phenomenon (Figure 1). “Associated with” doesn’t mean that all of these impacts happen during every El Niño episode. However, they happen more often during El Niño than you’d expect by chance, and many of them have occurred during many El Niño events.
Average location of the Pacific and Polar Jet Streams and typical temperature and precipitation impacts during the winter over North America. Map by Fiona Martin for NOAA Climate.gov.
In general, El Niño-related temperature and precipitation impacts across the United States occur during the cold half of the year (October through March). The most reliable of these signals (the one that has been observed most frequently) is wetter-than-average conditions along the Gulf Coast from Texas to Florida during this 6-month period. This relationship has occurred during more than 80% of the El Niño events in the past 100 years.
In Southern California and U.S. Southwest, strength matters
Over California and the Southwest, the relationship between El Niño and above-average precipitation is weaker, and it depends significantly on the strength of the El Niño. The stronger the episode (i.e., the larger the sea surface temperature departures across the central equatorial Pacific are), the more reliable the signal in this region has been.
For instance, during the two strongest events in the past 60 years (1982/83 and 1997/98), much-above-median rainfall amounts fell across the entire state of California. Median or above-median precipitation was recorded over the entire state during strong episodes in both 1957/58 and 1972/73 (Figure 2). However, strong events in 1991/92 and 2009/10 only provided small surpluses in the southern part of the state, while precipitation during 1965/66 was generally average to below-average across the state.
Figure 2. DIfference from average (1981-2010) winter precipitation (December-February) in each U.S. climate division during strong (dark gray bar), moderate (medium gray), and weak (light gray) El Niño events since 1950. Years are ranked based on the maximum seasonal ONI index value observed. During strong El Niño events, the Gulf Coast and Southeast are consistently wetter than average. Maps by NOAA Climate.gov, based on NCDC climate division data provided by the Physical Sciences Division at NOAA ESRL.
For weak and moderate strength episodes (Figure 2), the relationship is even weaker, with approximately one-third of the events featuring above-average precipitation, one-third near-average precipitation, and one-third below-average precipitation.
Elsewhere over the United States, El Niño impacts are associated with drier conditions in the Ohio Valley, and there is a less-reliable dry signal in the Pacific Northwest and the northern Rockies. Hawaii also often experiences lower-than-average rainfall totals from the late fall through early spring period.
The climate impacts linked to El Niño help forecasters make skillful seasonal outlooks. While not guaranteed, the changes in temperature and precipitation across the United States are fairly reliable and often provide enough lead time for emergency managers, businesses, government officials, and the public to properly prepare and make smart decisions to save lives and protect livelihoods.
Definitions
Weak El Niño: Episode when the peak Oceanic Niño Index (ONI) is greater than or equal to 0.5°C and less than or equal to 0.9°C.
Moderate El Niño: Episode when the peak Oceanic Niño Index (ONI) is greater than or equal to 1.0°C and less than or equal to 1.4°C.
Strong El Niño: Episode when the peak Oceanic Niño Index (ONI) is greater than or equal to 1.5°C.
References
Halpert, M.S. and C.F. Ropelewski, 1992: Surface Temperature Patterns Associated with the Southern Oscillation, J. Clim., 5, 577-593.
Ropelewski, C.F. and M.S. Halpert, 1987: Global and Regional Scale Precipitation Patterns Associated with the El Nino/Southern Oscillation, Mon. Wea. Rev., 115, 1606-1626
--- Emily Becker, lead reviewer


Comments
RE: south central
This region of the country is favored to have above normal precipitation during the period from October - March.
El Niño
RE: El Niño
Check out this article for the usual El Nino impacts on the US during winter. https://www.climate.gov/news-features/featured-images/how-el-ni%C3%B1o-and-la-ni%C3%B1a-affect-winter-jet-stream-and-us-climate
El Nino
What difference does it really make?
In every region of the country, looking at the maps above, during El Nino it is drier than normal about half the time, and wetter than normal about half the time. 55% correlation is something, but not in a sample size of only 20.
Pagination
Add new comment