June 2024 update: La Niña likely by late summer
After a year of dominance, El Niño released its hold on the tropical Pacific in May 2024, according to NOAA’s latest update. El Niño—the warm phase of the El Niño-Southern Oscillation (ENSO), our planet’s single largest natural source of year-to-year variations in seasonal climate—has been disrupting climate in the tropics and beyond since May 2023, likely contributing to many months of record-high global ocean temperatures, extreme heat stress to coral reefs, drought in the Amazon and Central America, opposing wet and dry precipitation extremes in Africa, low ice cover on the Great Lakes, and record-setting atmospheric rivers on the U.S. West Coast.
(That’s an incomplete list! I’d love to see readers use the comments to identify all the seasonal climate extremes over the past year that are consistent with the typical influence of El Niño.)
That’s a lot of climate upheaval. Is ENSO going to give us some time to idle in neutral (a state in between the warmer and cooler extremes of the El Niño-La Niña cycle) and catch our breaths? Not much, apparently. The tropical Pacific’s climate pendulum appears to be swinging back toward its other extreme: La Niña. In the Pacific, La Niña brings cooler-than-average temperatures in the central-eastern part of the basin, stronger winds both near the surface and at high altitudes, and heavier rain than normal over Indonesia and the rest of the Maritime Continent. The forecasting team thinks there’s a 65 percent chance that La Niña will arrive by July-September.
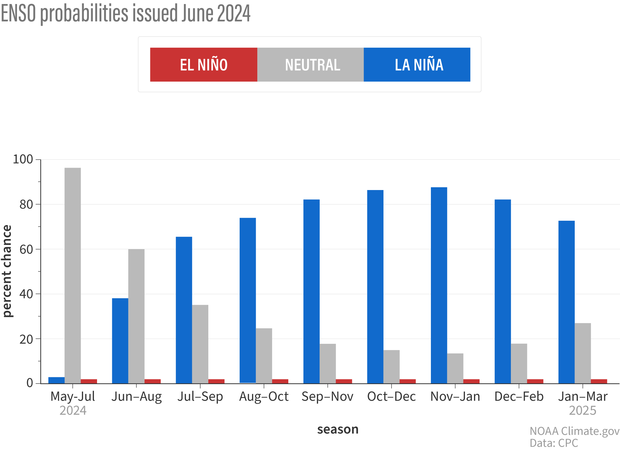
For each upcoming 3-month season, NOAA forecasts the chances of El Niño (red bars), La Niña (blue bars), or neutral conditions (gray bars) in the tropical Pacific. Neutral is overwhelmingly favored for the May-July period (labeled MJJ on the graph), but the chances for La Niña increase rapidly as soon as the June-August (JJA) period. By late summer (July-August-September, JAS), odds of La Niña are 65 percent. NOAA graph by Michelle L’Heureux.
That timing means there’s a pretty good chance La Niña will be around to influence the peak of the Atlantic hurricane season. (1) Even if the transition occurs more slowly, the odds of La Niña being in place by Northern Hemisphere winter are still 85 percent, which is similar to the NOAA forecast in previous months. Given those odds, it’s probably a good idea to refresh your memory of the typical impacts of La Niña on U.S. temperature and precipitation.
The slow pokey ocean
Emily explained in our April update that the atmospheric part of El Niño—weak-to-absent east-to-west trade winds across the tropical Pacific, dryness over Indonesia, strong convection and rainfall east of the International Dateline—had more or less shut down by early April. But surface water temperatures in the central-eastern tropical Pacific were still more than a degree Celsius (nearly 2 degrees Fahrenheit) warmer than the long-term average (long-term = 1991-2020), and some parts of the tropics still appeared to be experiencing El Niño’s typical side effects. Forecasters concluded it was too soon to issue El Niño’s curtain call.
Without the atmosphere reinforcing those warm anomalies (anomaly means “difference from average”), however, surface temperatures cooled off significantly through April and May. We’re already seeing stronger easterly (from the east) trade winds, which have cooled the overheated surface waters. You can see it happening in the animation below.

This animation shows weekly sea surface temperatures in the Pacific Ocean compared to average from March 18-June 9, 2024. Orange and red areas were warmer than average; blue areas were cooler than average. Warmer-than-average sea surface temperatures in the key ENSO-monitoring region of the tropical Pacific (outlined with black box) have started to be replaced by cooler-than-average waters—a sign that La Niña may be brewing. NOAA Climate.gov animation, based on Coral Reef Watch Data and maps from NOAA View. View the full-size version in its own browser window.
The most recent weekly and monthly observations from the key ENSO-monitoring region (dubbed “Niño 3.4”) show surface temperatures are close to average, and now cooler, deeper waters have begun surfacing. Now that both the atmosphere and the ocean have shifted away from El Niño, the event is truly over. Beneath the surface of the eastern pacific, a pool of cool water has been lurking for several months in standby mode, ready to re-supply the surface and intensify the cool anomaly required to create and maintain La Niña.
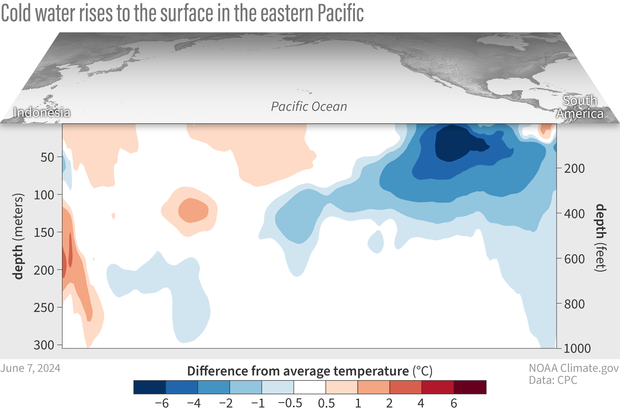
Water temperatures in the top 300 meters (1,000 feet) of the tropical Pacific Ocean compared to the 1991–2020 average in February–April 2024. NOAA Climate.gov animation, based on data from NOAA's Climate Prediction Center.
Historically, does big El Niño=big La Niña?
Of course, one of the most common questions we receive from readers is how strong do we expect the predicted La Niña to be? As far as model forecasts go, it’s too soon to put much stock in the forecasts: we’re just barely out of the notorious spring predictability barrier. The spread of possible outcomes is still pretty wide.
So, how about historical events? Does coming off a relatively strong El Niño like the recent one mean the developing La Niña will also be strong? That’s the question I posed to the team via email earlier this week. In true scientist fashion, Michelle answered me with a plot (2), which I have translated below.
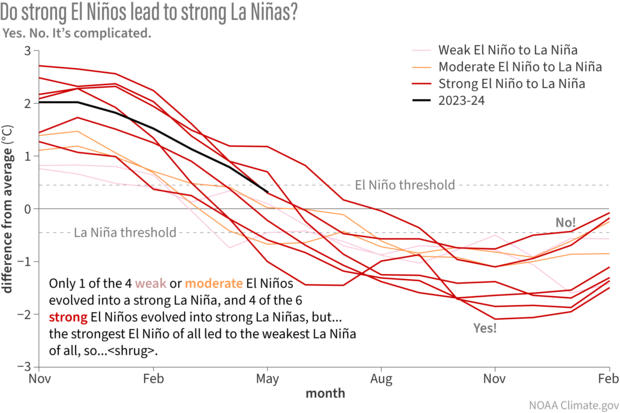
Since 1950, there have been 10 cases in which the ENSO climate pattern flipped from El Niño to La Niña with no neutral winter in between. Each line on this graph shows the evolution of sea surface temperature anomalies in the Niño-3.4 region of the tropical Pacific (the key ENSO-monitoring region) through the switch. Many, but not all, of the strongest El Niños (red lines) evolved into strong La Niñas. NOAA Climate.gov image, based on analysis by Michelle L'Heureux.
First things first, let’s acknowledge that there have only been 10 times in the historical record where ENSO flipped from El Niño into La Niña within a year. That’s not enough examples to draw any solid conclusions from. Still, it’s interesting to look at what we have and speculate as to what it might mean, so that’s all I am doing here.
Each line on the graph above represents a year in which the tropical Pacific shifted from El Niño to La Niña with no neutral winter in between. The lines are colored based on the strength of the El Niño: red for strong events (peak Niño 3.4-region sea surface temperature anomalies above 1.5 ˚C, or 2.7 ˚F), orange for moderate events (peak anomaly between 1 and 1.5 ˚C, or 1.8-2.7 ˚F), and pink for weak events (peak anomaly less than 1 ˚C, or 1.8 ˚F).
The relationship between the strength of the El Niño and the strength of the subsequent La Niña is kinda messy. It’s unlikely, but not impossible, for weak and moderate El Niños to lead to a strong La Niña (Niño 3.4 temperature anomaly of more than 1.5 ˚C below average). Only one of the pink and orange lines gets below that threshold. Meanwhile, 4 of the 6 strong El Niños do evolve into strong La Niñas. But before we put too much stock in that pattern, we should note that the strongest El Niño of all (top red line at the left hand side of the graph) wound up developing into the weakest La Niña (3). So…yeah. It’s complicated.
Strong events not required for strong impacts
The likely strength of the upcoming La Niña will become clearer the closer we get, and you’ll hear more about that in coming posts. Of course, it’s also important to remember that the strength of a given El Niño or La Niña isn’t a good predictor of the strength of the temperature or precipitation impacts in a particular place. Stronger events do make it more likely that places prone to be influenced by El Niño or La Niña will experience some level of their typical impacts, but they don’t necessarily lead to stronger impacts. In other words, even a moderate or weak La Niña can have a strong impact on a given place. So it’s important to pay attention to what we already know, which is that odds are very high (85% chance) that this winter will feature La Niña. If you’d like to know more about what a La Niña winter might mean for your part of the world, here are some great places to start.
- Global impacts of El Niño and La Niña
- U.S. impacts of El Niño and La Niña
- U.S. winter precipitation for the 20 strongest La Niña events (through 2021-22)
- U.S. winter temperature for the 20 strongest La Niña events (through 2021-22)
Footnotes
- Later this month, we’ll have a guest post about how La Niña influenced NOAA’s 2024 seasonal hurricane outlooks from lead forecaster Matt Rosencrans of NOAA’s Climate Prediction Center. In the meantime, you can read a vintage post from our early days and a more recent one with some additional detail.)
- Scientists use the word plot to refer to any data visualization, whether map or graph.
- This analysis defines strength based on how temperatures in the Niño 3.4-region compare to the long-term average in that area. By this definition, that top line is occupied by the 2015-16 El Niño. But as we have blogged about before, when it comes to ENSO impacts, what may matter more is how warm temperatures in that area are relative to the rest of the tropical oceans. Relative to the tropics-wide average, the warm anomaly associated with the 2015-16 event might not have been large enough to really count as record strong, which might explain why the La Niña that followed it was also not very strong.
Comments
The Roni data.
Hi. Have you contemplated using the RONI data to measure the equatorial temperatures?
I'm impressed! Not many…
I'm impressed! Not many people are familiar with Relative ONI (RONI) which came out of that work that Rebecca mentioned in footnote #3. For the last several years, CPC has monitored RONI on the side and it is located here:
https://www.cpc.ncep.noaa.gov/data/indices/RONI.ascii.txt
As you can see, the RONI is 0.1C for MAM 2024, which is considerably different from the 0.7C value in the traditional ONI.
However, NOAA's official alert system is based on the traditional Nino3.4/ONI values, so at this point, we follow the traditional indices.
La Nina
I'm searching information to be prepared for this Winter. We live in Northern California, Lake County next to the Largest natural fishing/resort lake in California our roads are Not the best because the County Does Not Spend the Money it was given during COVID-19 on our Public Roads and fix our Thousands and Thousands of Pot Holes that we have in this County they are Spending it on the enhancement of parks which they have ALREADY have worked on. I'm concerned about our Automobiles and having to Continuously repair and Replace windshields, tires rods and many other things on our cars and if we're going to have Heavy Rains I would like to be Prepared to Stock up and Not Travel as Much!
Effects of El Nino
I would add the exceptional 2023 forest fire season in Canada as an El Nino effect. That said, I would crawl back a little further into the extended La Nina that preceded it. British Columbia and the Canadian west are now in a third year of drought that appears, (in a few areas), to be abating. I would add the current heat dome in the western U.S. is a lingering El Nino effect.
Great job, by the way. Your forecasting has been spot on and the blog has the benefit of being a great teaching tool.
Have a cookie!
Good one. Because El Nino…
Good one. Because El Nino favors a more southward shifted jet stream you may very well be right! I have not seen a formal attribution, which would probably also consider the contribution from the warmer temperatures we tend to see these days (e.g. climate change). Thanks so much for the compliments!
Geography
I read your article every day. I am a student of geography. I feel very happy. I thank you for this because it gives me knowledge.
Really appreciate it!
Really appreciate it!
Great educational article, but...
I don't quite understand how an El Nino formed last year under a negative Pacific Decadal Oscillation ? We didn't have any kind of Winter weather here in the Southeast ( Kentucky,) and usually we have a colder, snowier Winter in past ENSO / El Nino events.
How could we be entering ENSO / neutral when the current PDO is a negative 2.97 ? That's ENSO / La Nina right ? I looked up the PDO readings, and found that the last ENSO / neutral reading 0.00 was December 2019.
With ENSO / La Nina a sure bet for this Fall and Winter, and it will be reacting with the atmosphere, because it's forming on a negative PDO. Here in Kentucky we will most likely experience another snowless Winter. A longtime ago ( 1917 - 18 ) we were in an La Nina year and recorded a very cold and snowy Winter. The records showed that this happen. Please explain.
Adding, the last cold and snowy Winter here in Kentucky was in 2015 -16. Under an ENSO / El Nino with a positive PDO.
Thank You,
Stephen S.
Hi-- we are favoring La Nina…
Hi-- we are favoring La Nina with a peak probability of 85% so still not 100% (some would consider that a sure bet). ENSO is based on coupled physics that happen within the tropical Pacific Ocean, so we primarily focus on the tropics. The PDO is interesting insofar as it may feedback on the topics, but that effect is considered small on seasonal timescales and more relevant to decadal averages.
ENSO
Hola me gustaría saber cómo analizar los datos que se tienen respeto al impacto de Fenómeno de La Niña en Perú.
Saludos, espero tu respuesta y apoyo
Hola - Peru's IGP has a lot…
Hola - Peru's IGP has a lot of great resources on ENSO in Peru: https://met.igp.gob.pe/
La Nina Strength
When can we say we are through the spring predictability barrier? I have been following the SSTs plots the since early May. The trend has been for weaker La Nina temps thus for. The latest NMME Nino 3.4 plot for June seems to moving closer to the IRI/CPC blended model. The NMME ensemble mean had peak temps below -1. The last run that came out a couple of days ago has La Nina peaking above -1 or a weak event.
Hi-- good question. There…
Hi-- good question. There is no one month where all of the sudden the accuracy gets considerably better, but generally the biggest rate of change is April-May-June, so there is an argument that we're over the hump, so to speak. With that said, the accuracy of our forecasts will increase the closer we get to the season that we are forecasting. So every month helps with the fine tuning. You're right that the forecasted intensity is not as strong as it was in previous months. Our latest ENSO strength forecast reflects those changes (this updates once a month w/ the discussion).
La Nina
Thanks Michelle!
La Niña is happening I hope so
La Niña is happening thank god I hope Wisconsin get a snow and cold winter no more El Niño. El Niño is noting but mean strong La Niña is better for snow than weak La Niña I don’t want this La Niña weak.
La Nina
The La Nina is trending toward a weak event, not a strong one.
Mexico
It would be great if you in the forecasting world could but your attention on Mexico for a bit because we really get so little analysis and prediction down here. I live in the Altiplano in Mexico which is the higher drier region in the north and center of the country and very often it seems that El Niño and La Niña both bring us even less rain, but of course it is not certain. Still we seem to do best with a neutral period. We've been in severe drought for years so I was hoping for neutral but alas, we are going to get a Niña. Anyway if any of you could focus on this region and try to create some models to show how ENSO and climate change are impacting it would be really helpful.
You may be interested in…
You may be interested in this Univ of Miami webpage with NMME forecasts of temperature and precipitation. This will take in account ENSO information and other factors that determine climate impacts over Mexico.
2023 Summer
I'm 66 years old and have lived in Texas and Louisiana most of my life. Summer 2023 was the hottest summer I've ever experienced. El Nino vs La Nina is too complicated for me to decipher, but I think El Nino was definitely the cause.
Re: 2023 summer
Well...Based on past episodes, El Niño has a small and not very reliable cooling influence on summer temps in the contiguous U.S. It tends to have a bigger and more consistent impact on winter temperature and precipitation. We know that one reason we are seeing increasingly frequent occurrences of record heat in the U.S. is long-term global warming. Averaged across Texas, summer temperatures have warmed by a tenth of a degree each decade since 1895, mostly due to warming nighttime temperatures.
https://www.ncei.noaa.gov/access/monitoring/climate-at-a-glance/statewi…
Scientists would have to do a kind of scientific study called an extreme event attribution in order to understand how much El Niño or other kinds of natural variability also contributed to any specific year's record heat.
Basic question about ENSO phases
The flip from a 3 year La Nina, to 1 year El Nino, then quickly back to La Nina is really interesting. It seems there isn't symmetry between the 2 phases. Would it be accurate to say ENSO processes are similar to the process of a volcano gathering molten magma before eruption?
As well, there have been numerous explanations for the ENSO cycles (trade winds being the huge factor) but one of the more recent parsimonious explanations is volcano like as it states:
"Think of the tropical Pacific as if it is a battery storing a charge, and the charge is thermal radiation coming in from the sun. Every cool La Nina phase is like a battery gathering and storing a charge from the sun, while every El Nino phase is like a battery discharging its thermal store."
This seems logical and to the point, without getting into trade winds and other complicated dynamic atmospheric processes. But is the above description accurate?
The above description does help differentiate ENSO as a standard atmospheric process vs. being a climate change process, which seems to be a popular misguided view.
Re: Basic questions
The idea that during La Niña the tropical Pacific is storing energy--"charging like a battery"— and during El Niño it is discharging energy seems like a reasonable analogy for the result of the ocean and atmosphere processes that drive the ENSO pattern phenomenon. But climate scientists aren't just interested in the result; they want to understand why and how things happen in the climate system.
You say a battery analogy allows us to dispense with all those messy and "complicated atmospheric dynamic processes." But a simple battery analogy would provide no explanation for all the parts of the system that we can easily observe. It doesn't explain why "the battery" is located in the western tropical Pacific and not the whole Pacific. It doesn't explain why the battery would ever discharge as opposed to endlessly accumulating energy. It doesn't explain why there is no equally strong battery in the tropical Atlantic Ocean or the tropical Indian Ocean, etc.
In other words, if we ever want to understand why and how the battery discharges--which we do, since it has such a strong influence on seasonal climate—we have to dig into the complicated stuff. As the quote usually attributed to Albert Einstein says, "Scientific explanations [theories] should be as simple as possible...but not simpler."
Awesome reply
Thank you for this!
There has been much made of La Nina and El Nino as "drivers of climate extremes" in the news since the really big 1997-98 El Nino event. Yet the news rarely explains what the 2 phases mean or involve, beyond being shorter term 'cool weather' and 'warm weather' climate phases.
The battery charge and discharge analogy seemed quite apt and very easy for any lay person to grasp, if not a little too conveniently simple.
As far as 'heat discharge' is concerned, a simple volcano analogy makes some sense. But then that begs the question, which might not strictly be an ENSO phase question, whether the equilibrium between cool Ninas and warm Ninos is shifting, as we've seen warmer oceans even through the recent "moderately strong" 2020-23 La Nina. (After all, hearing stories of batteries overheating with analogies of ...suns going supernova can't be too far off at this rate... I digress)
Surely we need more understanding of those dynamic, complicated atmospheric processes. A simple theory would be wonderful - there is much to comb through to, to begin to get close to having an idea of what's going on for the average lay person. But it is 100% worth it for those who want to know.
El Nino/Hawaii
I have had great interest in the effects of El Nino as they relate to the state I live in, Hawaii. I use this information to understand how our weather will be affected. I appreciate all the info that appears on this site.
La Niña
I m in Wyoming people here no nothing about La Niña or El Nina, I love to read everything about your site keeps me on my toes about our weather, people always expect a snowy winter unlike last year I told many about El Nina they had no Idea what I was talking about, I just wish people would read. Thanks for educating me. I will keep reading and learning. I believe your never to old to learn something new. And it looks like we are in for a snowy winter here in Wyoming, yet they are saying it will be mild, and our fall will be super hot.they need to read!!!
El Nino
I live almost at the tip of southwest India, in Kerela. We dread el Nino, with good reason.
We have 'normal' hot season from April to May. This year, 2024, the most unbearable high temperatures started February 20th until Mid May. I have lived here since 1992 and I can't remember such a long stretch of high heat. It was in the mid nineties with 81 percent dewpoint every day with no rain! And we do not have air conditioning!
We have many elderly people where I live and 4 or 5 died during that time.
During the 3 year of La Nina we were in bliss. The weather was unnaturally comfortable! The difference between el Nino and la Nina are like day and night for us. We are praying for another long La Nina!
re: El NIño in India
I am so sorry to hear that people in your community died from heat exposure. Your comment is a good reminder for those of us outside the tropics that for those actually in the tropics, the impacts of El Niño and La Niña are more consistent and potentially severe than they are in the subtropics and mid-latitudes, where the influence of El Niño and La Niña is weaker. That's a big part of the reason experts work so hard to understand and predict ENSO!
La NIna
Latest NMME 3.4 plot has come down with the strength of this La NIna. A borderline weak event now.
But remember: the ONI value…
But remember: the ONI value is only the ocean part of ENSO. Whether La Liña has actually begun or how strong it might be has to take into consideration whether the atmosphere is acting like La Niña, too!
La Nina
I live in the Pacific Northwest US, if we get a strong la Nina by the fall does it mean we'll have a lot of precipitation and snow during winter? Thanks!
La Niña in the PacNW
Depending on what part of the Pac NW you mean, the influence of La Niña on precipitation can be pretty strong. You can look back at these maps to see the patterns during 20 of the strongest La Niñas on record. That's total precip, though, not distinguishing rain from snow. Sometime before winter, we will probably do a La Niña version of this post, so stay tuned. You also have to keep in mind that long-term global warming is reducing snowfall in many U.S. locations; a percentage of winter precip that would have historically fallen as snow now falls as rain. So, it's possible that even if La Niña did historically tend to produce snowier winters in a particular place, it's impact may be more muted in today's warming climate. (Sorry to be a downer, if you are a snow fan!)
North Atlantic Temps
I've been studying the sea temperatures for the past 18 months surrounding the West of Scotland and can see the massive jump in our recorded daily averages last year.
We usually see a dip in February and get a period of colder temperatures but did not get this at all and instead of increasing we have seen the smallest temperature increase between now (20th June) and May that we have seen in years (the lowest ever in the data I am reviewing which is going back to 2013)
The El Nino doesn't affect us directly here in Scotland but it we have definitely seen the impact of it. I'm curious to see how this year will pan out as we are currently at a daily average of 2 degrees behind this time last year.
Thanks for this information it is extremely interesting.
West of scotland
Do you think La Niña will bring more settled weather this year into next for the west of Scotland?
It's hard to say. The impact…
It's hard to say. The impact from La Nina on climate conditions in Scotland can be hard to parse out. Normally other factors play a larger role
Couple of questions for graph of El Nino to La Nina
1) for the 6 strong El Niños in the graph, how many of them were considered CP (Modokai) El Niños vs EP (classic) El Niños, and what was the resulting strength of the La Niña? I believe the 2015-2016 El Niño might have been Modokai but not sure.
2) with a multi-year La Niña flipping to strong El Niño flipping back (presumably) to La Niña, are you seeing many atmospheric variables that are following the trends in the 2 possibly similar cases in the data (1970-74 and 2007-2011)? Both of those subsequent La Nina’s were strong and contained high impact weather events.
Hi Phil, Michelle wrote a…
Hi Phil,
Michelle wrote a really nice article describing the continuum that El Nino events can occur along. One key point in her article was that weaker El Niños tend to be closer to the Central Pacific types and stronger El Niños tend to be closer to Eastern Pacific types.
So I wouldn't necessarily classify the 6 strong events as CP events (with the caveat that, as I noted, there is nuance here)
As for variables following the trends of the past two events, it's hard to compare when the sample size is n=2. The other difficulty is the impact the above-average ocean temperatures worldwide might be having as well.
El Nino CP vs EP
This was an interesting study done at one of the Univ of Californias. The study called FY15/16 a mixed event. CP and EP. I wonder what the folks here think about it.
`https://agupubs.onlinelibrary.wiley.com/doi/full/10.1002/2016GL071515
Hi Bob, Thanks for sending…
Hi Bob,
Thanks for sending that interesting paper. The ENSO prediction team doesn't tend to forecast for CP/EP, nor classify events retrospectively, although we do have some discussion of ENSO flavors here on the Blog. The difference in SST maxima locations between the two events is likely part of the difference between the Southwest precip outcomes, but there are a lot of things going on in any one winter that contribute to variability. For more reading, check out the BAMS paper (led by Michelle) on observing and predicting the 2015/16 event and this paper about the variability in US precip during El Nino events.
ENSO
Thanks Emily!
How does this relate to Poland?
How does this relate to Poland?
Similar to Scotland, Poland is also experiencing climate change and temperature anomalies. In recent years, we have seen an increase in average temperatures, especially noticeable in the summer season. Although Poland is not directly affected by El Nino, its global effects can influence our weather patterns. In recent years, we have recorded unusually warm winters and summers, which may indicate similar trends to those observed in Scotland.
If the trend of warming seas continues, it could impact marine ecosystems in both Poland and Scotland, as well as our weather patterns. It is important to conduct further research and observations to better understand these changes and their potential consequences. Thank you for sharing your insights.
Impacts of El Niño / La Niña
Always a very informative read! thanks a lot!
On the impacts of El Niño, let's not forget the devastating drought in Southern Africa - which may lead to widespread hunger in the coming months.
I was wondering about your views regarding the World Weather Attribution Report stating that the May flooding events in East Africa had no relation to El Niño: what's your analysis?
Final question: can we say that the strength of Hurrican Beryl is an early sign of the upcoming La Niña?
Greetings from Nairobi.
Priscilla
Hi Priscilla - Thanks for…
Hi Priscilla - Thanks for the report from Nairobi. I haven't seen that report, but I can confirm that El Nino likely had little to do with flooding in East Africa in May. The El Nino impact in Eastern Africa is strongest over the October–January period. Regarding Beryl, it's really difficult to attribute the strength of a single storm, and ENSO is currently neutral and so does not have much influence on global atmospheric circulation.
July NMME continues the…
July NMME continues the trend of a weakening La Nina
La niña impact in Parana River Basin
We have seen and extreme low river flow in the last 6 years. With two niñas in a row and a short el niño I have never in my life seen this great river with less water for a long time like this. Is this the new normal due to weather/soil/atmosphere variations? Is the atmospheric river which flows from the north shifted to rio grande do sur instead of parana its rainfall patern?
Only time will give us the answer.. Hope la niña drought impact will not be severe. We are having this year colder winter than average.
Thank you four your posts big fan of your work..
Parana River Basin
That's a good question, and I don't have an immediate answer. The frequent La Ninas in recent years may be contributing to the dryness in the region, but there are other possible contributing factors like soil moisture variations, chaotic weather variability, and climate change, as you mention. I am now working with an undergraduate intern who is investigating projected changes in atmospheric rivers over South America, so I hope to gain a better understanding of the possible role of climate change in the near future.
Elnino
When is Elnino likely to end in Zambia 🇿🇲?
El Nino and Zambia
El Nino is a global phenomenon, so when it is declared to have ended, it has ended for all regions, including Zambia. I am guessing that you may be wondering about the effects on the severe drought over that region. I am not sure when we can expect significant relief (please check relevant resources like this), but we can be confident that El Nino will not be a significant cause of prolonging the severe drought further.
Add new comment