2024: An active year of U.S. billion-dollar weather and climate disasters
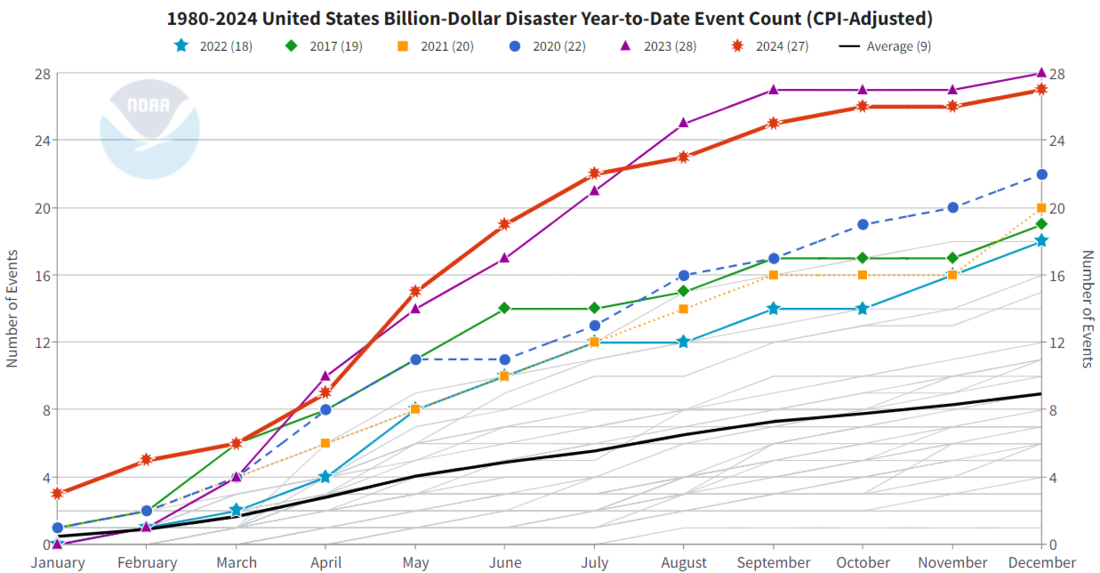
NOAA’s National Centers for Environmental Information (NCEI) has updated its 2024 Billion-dollar disaster analysis. In 2024, there were 27 individual weather and climate disasters with at least $1 billion in damages, trailing only the record-setting 28 events analyzed in 2023. These disasters caused at least 568 direct or indirect fatalities, which is the eighth-highest for these billion-dollar disasters over the last 45 years (1980-2024). The cost was approximately $182.7 billion.
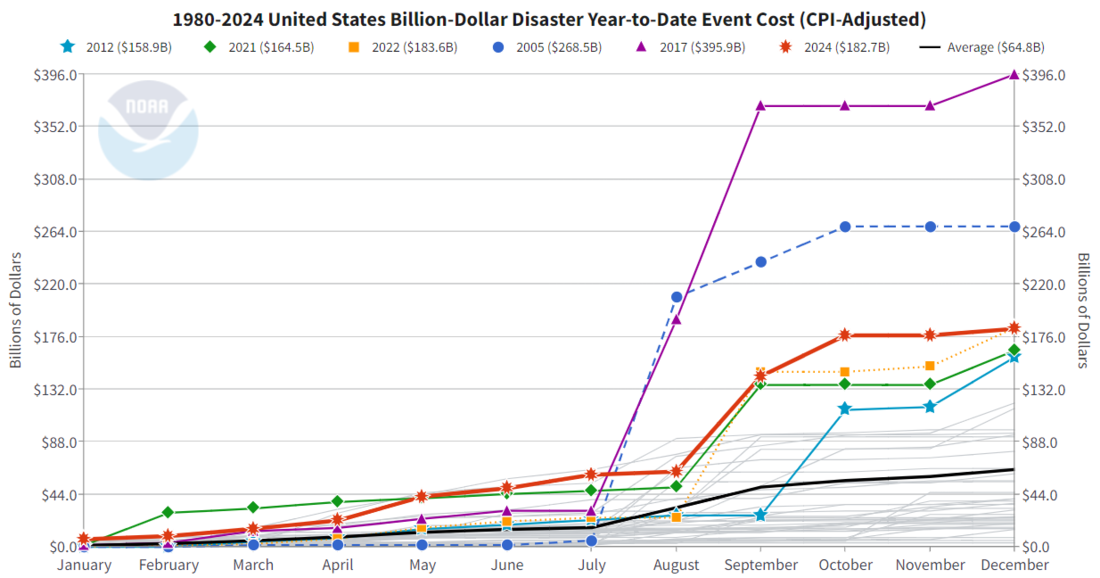
This total places 2024 as the fourth-costliest on record, trailing 2017 ($395.9 billion), 2005 ($268.5 billion) and 2022 ($183.6 billion). Adding the 27 events of 2024 to the record that begins in 1980, the U.S. has sustained 403 weather and climate disasters for which the individual damage costs reached or exceeded $1 billion. The cumulative cost for these 403 events exceeds $2.915 trillion.
Before presenting the analysis of 2024, here are a few notes for additional context. This research is a quantification of the weather and climate disasters that in 2024 led to more than $1 billion in collective damages for each event, and all prior-year cost estimates are adjusted for inflation to 2024 dollars using the Consumer Price Index. Additionally, these cost totals for 2024 are based on analysis through January 10th, 2025, and may rise an additional several billion dollars, as new data become available. This analysis is conservative, as it excludes events with less than $1 billion in damages in 2024 dollars. However, it does include 57 events since 1980 that were originally below the billion-dollar threshold but are now above $1 billion in 2024 dollars.
The billion-dollar disasters of 2024 came from multiple categories:
- 2 winter storm/cold wave events (across the Northwest and central/southern U.S. in mid-January).
- 1 wildfire event (the South Fork Fire in New Mexico that destroyed many homes, vehicles, businesses and other infrastructure).
- 1 drought and heat wave event (causing impacts across the southern, eastern and northwestern U.S.).
- 1 flooding event (the Upper Midwest Flooding in mid-June across several states).
- 6 tornado outbreaks (across the central and southeastern U.S.).
- 5 tropical cyclones (Beryl, Debby, Francine, Helene and Milton – the final two were the costliest U.S. disasters of 2024).
- 11 severe weather/hail events (across many parts of the country).
In 2024, the United States experienced 27 separate weather or climate disasters that each resulted in at least $1 billion in damages. NOAA map by NCEI.
Costliest U.S. billion-dollar disasters of 2024
Among the many weather and climate-related disasters to affect the U.S. in 2024, the following caused the most damaging impacts and heavily impacted many communities.
Hurricane Helene, September 24-29: 219 deaths, $79.6 billion
Category 4 Hurricane Helene with 140 mph sustained winds was the strongest hurricane on record to strike the Big Bend region of Florida having made landfall near Perry, Florida on September 26. Helene was the third hurricane to hit the Big Bend region in just over a year. It caused up to 15 feet of storm surge along the Big Bend coast and six feet of surge as far south as St. Petersburg. It also caused billions of dollars in damage to Georgia's agriculture sector. Helene's most severe impacts were from the historic rainfall (up to 30+ inches) and flooding across much of western North Carolina.
This photo from September 29, 2024, shows a damaged railroad bridge and mud-covered streets in Asheville, North Carolina, following flooding on the Swannanoa River during Hurricane Helene. Photo by Adam B. Smith.
This flooding eclipsed the region's previous worst flood from 1916. Asheville and many surrounding cities and communities were heavily impacted. Southwestern Virginia and extreme eastern Tennessee were also heavily impacted. Damage came in many forms. Landslides, debris flows, and historic levels of flooding inundated and destroyed homes, businesses, parks, hospitals, the electrical, cellular and water system infrastructure, and damaged thousands of roads, highways and bridges, as examples. Additional information is currently being assembled that summarizes the vast scope of damage produced by Helene. Helene was the deadliest Atlantic hurricane since Maria (2017), and the deadliest to strike the U.S. mainland since Katrina (2005).
Between September 23 and 28, the highest 3-day rainfall totals across the higher elevations of the southern Appalachian Mountains were so extreme that the statistical chances of them being exceeded in an any given year were 1 in 1,000 (black areas). Statistically, this is the same as saying that averaged over long periods of time, a 3-day rainfall event so extreme would only occur on average (not literally!) once every 1,000 years. NOAA Climate.gov graphic, adapted from original by NOAA's National Weather Service.
Hurricane Milton, October 9-10: 32 deaths, $34.3 billion
Category 3 Hurricane Milton with 120 mph sustained winds made landfall near Siesta Key, Florida on October 9. A storm surge of 5 to 10 feet caused damage from Naples to Charlotte Harbor. Milton's track to the south of Tampa Bay lessened storm surge impacts on the densely populated Tampa metro region.
A Florida Fish and Wildlife officer helps to evacuate a flooded Florida neighborhood in the aftermath of Hurricane Milton on October 10, 2024. Florida Fish and Wildlife photo from their Flickr account. Image has been cropped and brightened. Used under a Creative Commons license.
Dozens of tornadoes were also spawned from Milton, damaging homes, businesses, vehicles and other infrastructure across southern Florida. Milton underwent rapid intensification into a Category 5 hurricane with 180 mph sustained winds and a 897 mb central pressure reading. An environment of enhanced wind shear the day prior to landfall reduced Milton's peak wind potential.
Hurricane Beryl, July 8: 46 deaths, $7.2 billion
GOES-16 satellite imagery of Hurricane Beryl on July 1, 2024, as it rapidly intensified in the Caribbean Sea. Hours after this image was taken, Beryl strengthened into a catastrophic Category 5 hurricane. Credit: CSU/CIRA & NOAA
Category 1 Hurricane Beryl made landfall in Texas on July 8, producing widespread high wind damage, as the storm was re-strengthening at landfall. One significant impact was power outages that impacted millions of people for days. Beryl also produced more than 50 tornadoes across eastern Texas, western Louisiana and southern Arkansas. On July 1, Beryl became the earliest Category 5 hurricane and the second Category 5 on record during the month of July in the Atlantic Ocean.
Central, southern & southeast tornado outbreak, May 6-9: 3 deaths, $6.6 billion
An outbreak producing more than 165 tornadoes developed across many central, southern and southeastern states. The states most affected include Oklahoma, Kansas, Nebraska, Michigan, Indiana, Ohio, Kentucky, Tennessee, Alabama, North Carolina, South Carolina, Georgia and Florida. This multi-day tornado outbreak produced at least 61 EF-0, 79 EF-1, 13 EF-2, three EF-3, one EF-4 tornado and dozens of EF-U (unknown/unrated) tornadoes, causing widespread damage to homes, businesses, vehicles, agriculture and other infrastructure. The towns of Barnsdall and Bartlesville, Oklahoma, were impacted by an EF-4 tornado that caused extensive damage.
2024 costs in historical context
The year 2024 (red line) is the 14th-consecutive year (2011-2024) in which 10 or more separate billion-dollar disaster events have impacted the U.S. The 1980–2023 annual average (black line) is 9.0 events; the annual average for the most recent 5 years (2020–2024) is 23.0 events.
Month-by-month accumulation of billion-dollar disasters for each year on record. The colored lines represent the top 6 years for most billion-dollar disasters. The dark gray line shows the average. All other years are colored light gray. NOAA NCEI Billion-dollar Disasters webpage.
Over the last ten years (2015-2024), the U.S. has been impacted by 190 separate billion-dollar disasters that have killed more than 6,300 people (direct and indirect fatalities) and cost ~$1.4 trillion in damage. The U.S. mainland has been impacted by landfalling Category 4 or 5 hurricanes in six of the last eight years, including Hurricanes Harvey, Irma, Maria, Michael, Laura, Ida, Ian and Helene. The impacts from Hurricanes Helene and Milton were particularly destructive, causing more than $100 billion in combined damage across Florida, Georgia, South Carolina, North Carolina, Tennessee, and Virginia over a two-week period from late-September into early October.
Month-by-month accumulation of estimated costs of each year's billion-dollar disasters, with colored lines showing 2024 (red) and the other top-10 costliest years. Other years are light gray. 2024 finished the year in fourth place for annual costs. Screenshot from the NOAA NCEI Billion-dollar Disasters webpage.
The total cost of U.S. billion-dollar disasters over the last 5 years (2020-2024) is $746.7 billion, with a 5-year annual cost average of $149.3 billion. This 5-year cost average is more than double the 45-year (1980-2024) annual cost average of $64.8 billion for all of the billion-dollar disaster events.
Increasing trend of disasters: exposure, vulnerability, and influence of climate change
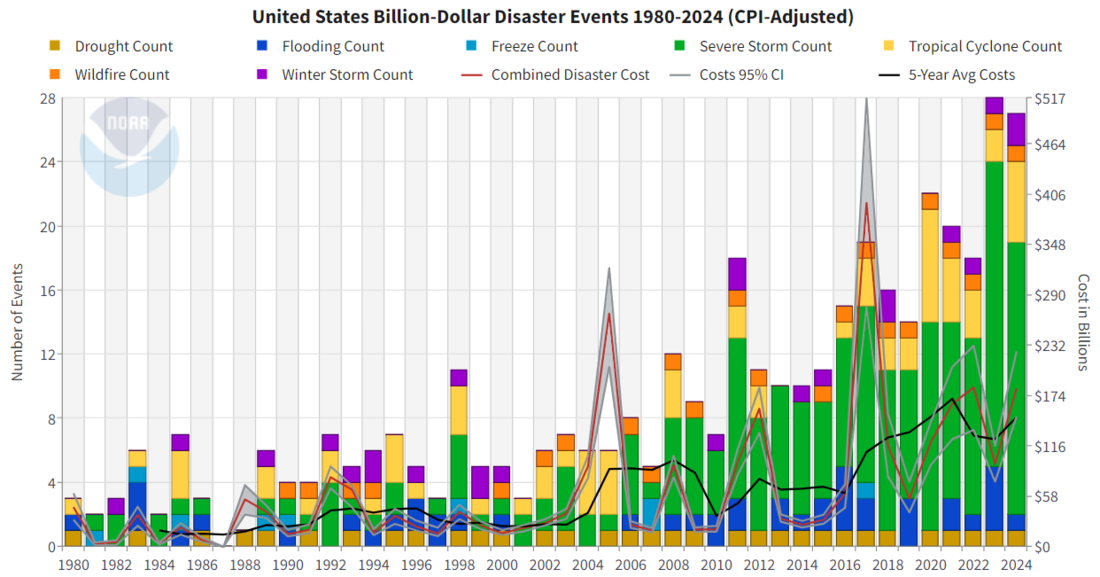
It is clear that the number of billion-dollars disasters and their total costs have risen since 1980. Even though the analysis adjusts for inflation, none of the highest years are from before 2000. The graph below shows it more clearly.
The history of billion-dollar disasters in the United States each year from 1980 to 2024, showing event type (colors), frequency (left-hand vertical axis), and cost (right-hand vertical axis) adjusted for inflation to 2024 dollars. NOAA NCEI Billion-dollar Disasters webpage.
Losses from the billion-dollar disasters tracked by NCEI have averaged $140 billion per year over the last decade (NCEI, 2025). 2017 was the costliest year, exceeding $300 billion—proportional to about 25% of the $1.3 trillion building value put in place that year (Multi-Hazard Mitigation Council, 2019, full report).
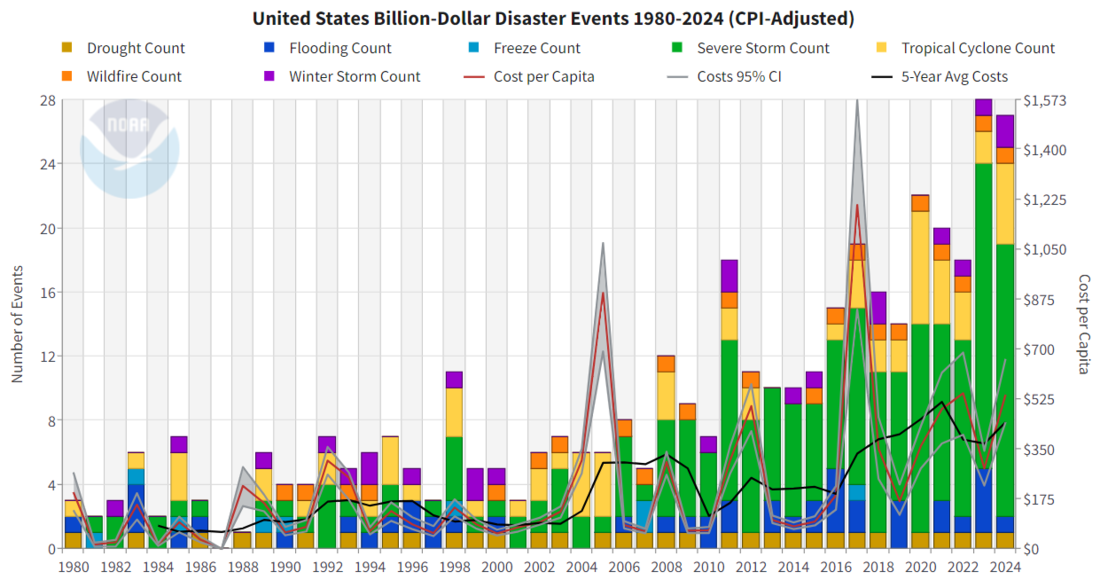
The cost per capita (see right y-axis in chart below) has also remained at a high level for the U.S. as a whole since 2017 when compared to previous years even after adjusting for CPI-inflation. This indicates that the costs of the billion-dollar disasters are rising more sharply than general population growth. The chart shows the 5-year-average disaster cost per capita was about $150 (inflation-adjusted) per U.S. resident in the early-2000s. The 5-year average disaster cost per capita then increased above $400 per person in the late 2010s and has remained at a high level in recent years.
The history of billion-dollar disasters in the United States each year from 1980 to 2024, showing event type (colors), frequency (left-hand vertical axis), and total cost (right-hand vertical axis) adjusted for inflation using the Consumer Price Index. NOAA NCEI Billion-dollar Disasters webpage.
There are several potential explanations for these trends, including increases in exposure (i.e., more assets at risk); increases in vulnerability (i.e., the amount of damage a hazard of given intensity, such as high winds, can cause at a location); and increases in the frequency and intensity of some types of extreme events due to human-caused climate change (National Academies of Sciences, Engineering, and Medicine. Compounding Disasters in Gulf Coast Communities 2020-2021: Impacts, Findings, and Lessons (2024); Multi-Hazard Mitigation Council. Natural Hazard Mitigation Saves (2019); Fifth U.S. National Climate Assessment (2023).
A major driver of increased costs of extreme weather is the increase in population and material wealth over the last several decades. For example, in an analysis of recent disasters in the Gulf of Mexico region, the National Academies concluded, “Exposure to extreme weather and climate hazards in the Gulf of Mexico state region is increasing as a result of population growth and increased construction of public and private development in hazard-prone areas" (National Academies of Sciences, Engineering, and Medicine. Compounding Disasters in Gulf Coast Communities 2020-2021: Impacts, Findings, and Lessons, 2024).
Much of this growth and property development has continued in high-risk areas like coasts, the fire-prone wildland-urban interface in the West, and river floodplains. Increased building and population growth in these high-risk areas mean that more people and property are at risk and so also contribute to larger losses (CBO report “Climate Change, Disaster Risk, and Homeowner’s Insurance,” 2024). Areas where building codes are insufficient for reducing damage from extreme events are especially vulnerable to more expensive extreme weather.
Population growth and how and where we build play a big role in the increasing number and costs of billion-dollar disasters. But we also know from extreme event attribution research that human-caused climate change is increasing the frequency and intensity of certain types of extreme weather that lead to billion-dollar disasters—most notably the rise in vulnerability to drought, lengthening wildfire seasons in the Western states, and the potential for extremely heavy rainfall becoming more common in the eastern states. Sea level rise is worsening hurricane storm surge flooding. (Read more about changes in climate and weather extremes in the Fifth U.S. National Climate Assessment (2023). Given those trends, it’s likely that human-caused climate change is having some level of influence on the rising costs of billion-dollar disasters.
Some mix of these factors is likely the reason that the 2010s decade was far costlier in the Billion-Dollar Disaster data set than the 2000s, 1990s, or 1980s, even when adjusted for inflation to current dollars). See the table below.
This table shows summary statistics of billion-dollar disasters by decade and by latest 1, 3-, and 5-year periods. Costs over the last complete decade, the 5-year average, and the 3-year average are all higher than the costs of the 1980s, 1990s, and 2000s. Screenshot from NOAA NCEI Billion-dollar Disasters webpage.
1980-2024 U.S. costs and fatalities by disaster type
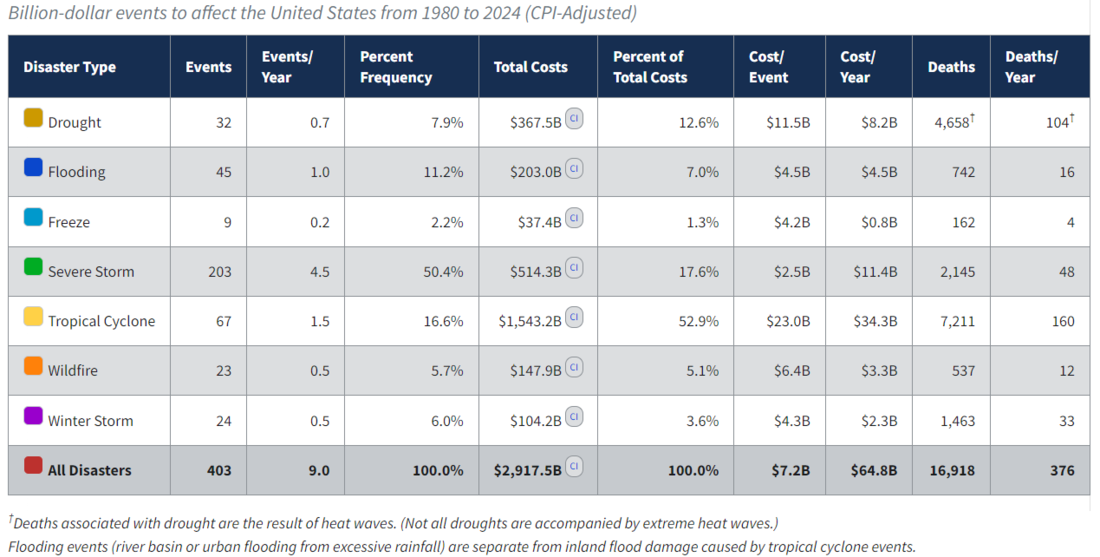
Tropical cyclones caused the most damage from 1980 to 2024 ($1,543.2 billion) and had the highest average event cost ($23.0 billion per event). Severe storms ($514.3 billion), drought ($367.5 billion), and inland flooding ($203.0 billion) also caused considerable damage. Severe storms account for the highest number of billion-dollar disaster events (203), but they have the lowest average event cost ($2.5 billion), which is consistent with their localized nature. Tropical cyclones and flooding represent the second and third most frequent event types (67 and 45), respectively. Tropical cyclones are responsible for the highest number of deaths (7,211), followed by drought/heatwave events (4,658) and severe storms (2,145).
This table shows the breakdown, by hazard type, of the 403 billion-dollar weather and climate disasters assessed since 1980. Severe storms are far and away the most frequent type of billion-dollar disaster. Screenshot from the NOAA NCEI Billion-dollar Disasters webpage.
Disasters by region
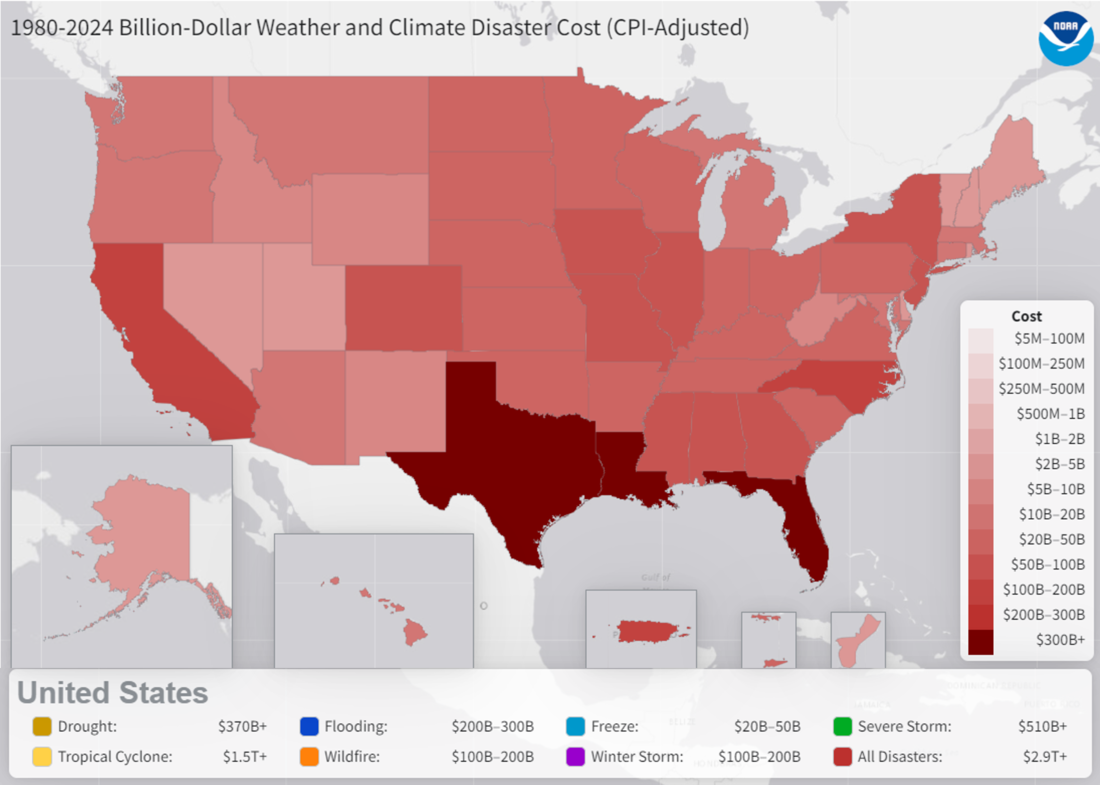
The South, Central, and Southeast regions of the United States, including the Caribbean U.S. territories, have suffered the highest cumulative damage costs, reflecting the severity and widespread vulnerability of those regions to a variety of weather and climate events.
This map depicts the total estimated cost borne by each state from billion-dollar weather and climate events from 1980-2024. Screenshot from NOAA NCEI Billion-dollar Disasters webpage.
Florida leads the U.S. in total cumulative costs (~$450 billion) from billion-dollar disasters since 1980 largely due to the impact of hurricanes. Texas is the second-leading state in total costs since 1980 (~$436 billion), but it has been affected by the highest number of billion-dollar disasters since 1980. Louisiana’s total costs are the 3rd highest (~$314 billion) from billion-dollar disasters.
Map of costs of billion-dollar disasters per 1 million residents by state during 2024. Screenshot from NOAA NCEI Billion-dollar Disasters webpage.
Billion-dollar disasters by month
The 45-year climatology of U.S. billion-dollar disasters offers a view of risk from extreme events, which are often seasonal in nature. For example, during the spring months (March-May) severe storms (green blocks), including tornadoes, hail, and high winds, often occur in many Central and Southeast states, but they taper off in the second half of the year.
The monthly climatology of U.S. billion-dollar weather and climate disasters from 1980 to 2024, showing which months have the greater frequency of disasters (height of bar) and which types of events (colors) are most likely to occur in a given month. Screenshot from NOAA NCEI Billion-dollar Disasters webpage.
During the spring months there is also greater potential for major river flooding (i.e., deep blue events in chart above). U.S. springtime flooding from snowmelt and/or heavy rainfall is a persistent hazard that affects many towns and agriculture regions within the Missouri and Mississippi River basins, among others. During the fall season, Gulf and Atlantic coast states must be vigilant about hurricane season particularly during August and September (i.e., yellow events in chart above).
There were 26 separate billion-dollar, non-hurricane flood events during the last 15 years (2010-2024). There were only 19 separate billion-dollar, non-hurricane flood events during the preceding 30 years (1980s, 1990s and 2000s) - all CPI-adjusted to 2024 dollars. The growth in property exposure in the floodplains is a big driver in losses. In addition, a warming atmosphere holds more water vapor and has increased potential to produce heavy rainfall / flooding. (National Academies of Sciences, Engineering, and Medicine. Compounding Disasters in Gulf Coast Communities 2020-2021: Impacts, Findings, and Lessons (2024)).
Also, the peak of the Western U.S. wildfire season occurs during the fall months of September, October and November (i.e., orange events in chart above). California, Oregon, Washington, Idaho, Montana and Colorado often experience enhanced wildfire risk and related poor air quality for weeks to months.
Western wildfire damage during the 2017-2021 period was historic, exceeding $90 billion in 2024 dollars compared to only $58 billion in combined damage for the other 18 BDD wildfire events since 1980. The multi-year, “D4-exceptional” Western drought (2014-2016) and the continual growth of the built environment along the wildland-urban interface likely contributed to the catastrophic wildfires of the 2017-2021. 17 of the 20 largest California wildfires by acreage and 18 of the 20 most destructive wildfires by the number of buildings destroyed have occurred since the year 2000 (Cal-Fire stats, 2025).
In total, each region of the U.S. faces a unique combination of recurring hazards, as billion-dollar disaster events have affected every state since 1980. The combined historical risk of U.S. severe storms and river flooding events places the spring and summer seasons in the high-risk category for simultaneous extreme weather and climate events, while hurricanes, wildfires and drought dominate the fall season.
Compound extremes
The increase in disasters creates 'compound extremes' (e.g., billion-dollar disaster events that occur at the same time or in sequence), which are also an increasing problem for recovery. As noted in the recent Fifth National Climate Assessment (2023), "climate change is also increasing the risk of multiple extremes occurring simultaneously in different locations that are connected by complex human and natural systems.” For instance, simultaneous megafires across multiple western states and back-to-back Atlantic hurricanes in 2020, 2022 and 2024 or numerous tornado outbreaks can create high demand on local, state and federal emergency response resources.
This graph shows the percent frequency of a given month having at least one billion-dollar disaster (light pink bars), 2 or more events (medium pink bars), 3 or more (red), 4 or more (darker red), or 5 or more (darkest red). Billion-dollar weather and climate disasters occur in all months, but the spring and summer (March–Aug) are the time when multiple, concurrent disasters are likely. A second maximum occurs in the Fall driven by tropical cyclones. Screenshot from the NOAA NCEI Billion-dollar Disasters webpage.
Writing about these challenges for the Gulf region, the National Academies concluded (full report):
[R]ecent studies in attribution science show that climate change is causing an increase in the frequency and/or severity of tropical storms, heavy rainfall, and extreme temperatures. The intensification of these and other more extreme weather-climate events are intersecting with areas experiencing high levels of health disparities, social vulnerabilities, and increased exposure due to population growth in hazard-prone areas. This convergence is resulting in prolonged and overlapping periods of disaster recovery. While hazards may be unalterable, their impact can be reduced by collectively building adaptive capacity—whether preemptive, in real time, or through the recovery process—within vulnerable and exposed systems, institutions, and people.





Comments
Biggest fire to ever hit Calif up to 2024 was the Borel Fire
This information is not forthright on cost, fires and families and many animals of all kinds destroyed in 2024! In 2024 was the biggest fire to ever hit California and it’s not even mentioned or on any maps! People and families and animals still trying to recover form it! The burn scar was so hot so deep, Fear of what kind of mud slides haunt all of us whom live within 50miles of this Enormous fire! THE BOREL FIRE”.Just abit frustrating reading this article when the information is way off!!!God to make a path and set the way for so may families and animals are in such dispare in this 2025 Fire that has taken and hurt so many!
Re: biggest fire to ever hit Calif
I'm so sorry to hear of the devastation that the Borel Fire brought to your community. The billion-dollar disaster report captures only a subset of the terrible tragedies and destruction that occur each year--those whose economic damages reach or exceed 1 billion dollars. It appears that the Borel Fire did not meet that threshold.
When it comes to fires, the size of the fire is only indirectly related to the analysis; larger fires have more potential to cause higher damages, but it depends a lot on whether they burn in rural areas versus at the wildland-urban interface.
It appears that the Borel Fire was the second-largest of the 2024 season, but it doesn't appear in any of the top 20 "all time" lists that Cal Fire maintains on their website:
But I will say again, that this analysis is a measure of only one specific type of disaster, and just because the Borel Fire didn't qualify doesn't mean those affected by it suffered any less than those whose disasters did make the list.
What happened to the natural…
What happened to the natural wildland fires in Hawaii??
Re: Hawaii fires
The Hawaii fires occurred in 2023. This post is about billion-dollar events in 2024. If you want to explore previous year's events, you can visit the NCEI page and use the slider at the top to select a single year or a range of years.
You can also read last year's blog post.
Recent article lacking relevant information.
This article failed to mention the 3 hurricanes on the east coast. As well as the 6 major fires in LA? No mention in the difference in the time of response or funds for both of those disasters. I find that interesting considering the time the was released or updated.
Re: Recent article lacking...
This blog post was the 2024 recap, so it doesn't include analysis of any 2025 events, such as the LA fires.
Regarding the "three hurricanes on the East Coast", I am not sure which ones you were thinking of, but all landfalling hurricanes are evaluated as possible billion-dollar disasters, and in 2024, 5 of them qualified:
That doesn't mean other hurricanes produced no impacts; it just means that they didn't produce a billion dollars or more in damages.
Although the blog post only provided details for the top 3 costliest disasters of 2024, you can get summaries of all the events from the NCEI website.
Add new comment