State of the Climate: 2011 Humidity
A variety of gases contribute to Earth’s natural greenhouse effect, including methane, carbon dioxide, and water vapor. In addition to helping regulate the Earth’s surface temperature, water vapor is also a key stage of the water cycle, ferrying water and heat through the atmosphere from one place on Earth to another. On an everyday level, the amount of water vapor in the air—the humidity—influences how hot and sticky the air feels and how hard an air conditioner has to work for us to feel cool.
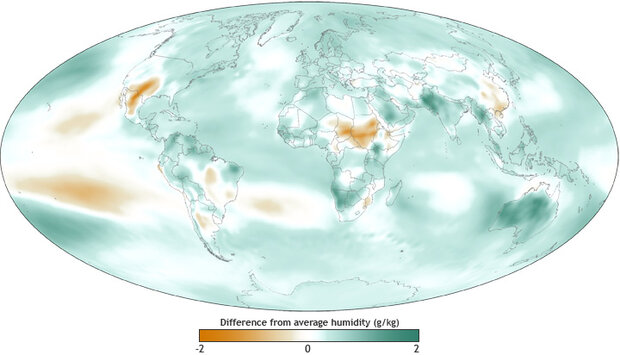
The map shows measurements of specific humidity in grams of water per kilogram of air across the globe in 2011 compared to the long-term average. Shades of green indicate places where the air contained up to 2 grams more water per kilogram of air than the 1981-2010 average, while rusty brown indicates lower-than-average amounts of water vapor. Map by Dan Pisut, NOAA Environmental Visualization Lab, based on ERA-Interim reanalysis data.
The map above shows measurements of specific humidity in grams of water per kilogram of air across the globe in 2011 compared to the long-term average. Shades of green indicate places where the air contained up to 2 grams more water per kilogram of air than the 1981-2010 average, while rusty brown indicates lower-than-average amounts of water vapor.
Compared to 2010, which began with El Nino and ended with La Nina, the atmosphere in 2011 was cooler and drier—although more humid than the long-term average. The influence of La Niña throughout 2011 is evident over the Pacific Ocean, where cooler waters suppressed evaporation, leading to a less humid than average atmosphere in the region. The air over Australia on the other hand, was unusually humid; in the western Pacific, La Niña is consistently accompanied by warmer than normal temperatures which spur greater evaporation.
Just a few pockets of dryness occurred globally: in eastern China, Mexico, east-central Africa, and the southern US, where a historic drought event took place last summer. The near-global extent of moister-than-average air in 2011 is consistent with an emerging trend toward increasing specific humidity worldwide.

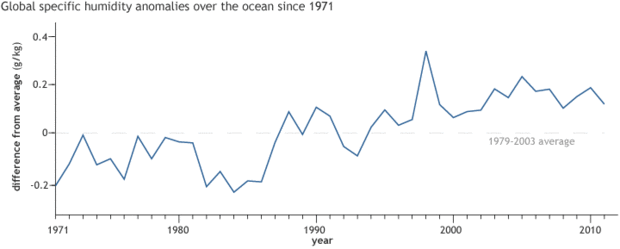
The graph shows one time series of humidity observations from over the ocean based on direct observations made since the early 1970s. Direct measurements of specific humidity over land, as well as some—but not all—weather model reanalyses of global humidity show the same trend; none of the analyses show a drying trend in specific humidity. Graph adapted from Figure 2.15 in the BAMS’ State of the Climate in 2011.
The graph above shows one time series of humidity observations from over the ocean based on direct observations made since the early 1970s. Direct measurements of specific humidity over land, as well as some—but not all—weather model reanalyses of global humidity show the same trend; none of the analyses show a drying trend in specific humidity.
The agreement among the different sources of data suggest the increase is real, but there is still uncertainty in how big a change in Earth’s specific humidity has taken place in the past few decades. And while the specific humidity—the amount of water vapor–seems to be increasing over land and ocean, the relative humidity—how close the air is to being completely saturated with water vapor—has decreased over many land areas.
At first glance, that seems impossible. How can the atmosphere be getting less saturated if there is more water vapor in the air? It’s possible because saturation—the point at which water vapor condenses back into water or ice, often forming clouds—depends on the air temperature, and air temperature around the world is also rising. Over many land areas, it’s getting warmer faster than it is getting wetter, which means the air is less saturated (relative humidity goes down), even as specific humidity goes up.
Map by Dan Pisut, NOAA Environmental Visualization Lab, based on ERA-Interim reanalysis data. Graph adapted from Figure 2.15 in the BAMS’ State of the Climate in 2011. Reviewed by Jessica Blunden and Deke Arndt, Climate Monitoring Branch, National Climatic Data Center; and Kate Willet, UK Met Office.
Reference
Willett, K.M., D. Berry, and A. Simmons, 2012: [Global climate] Surface humidity [in “State of the Climate in 2011”]. Bull. Amer. Meteor. Soc., 93 (7), S23–S25.
![]()
