Highlights from 'State of the Climate in 2023'
Highlights
- Earth’s greenhouse gas concentrations were the highest on record.
- Record temperatures notable across the globe.
- El Niño conditions contributed to record-high sea surface temperatures.
- Ocean heat and global sea level were the highest on record.
- Heatwaves and droughts contributed to massive wildfires around the world.
- The Arctic was warm and navigable.
- Antarctica sea ice sets record lows throughout 2023.
- Tropical cyclone activity was below average, but storms still set records around the globe.
Greenhouse gas concentrations, the global temperature across land and oceans, global sea level and ocean heat content all reached record highs in 2023, according to the 34th annual State of the Climate report.
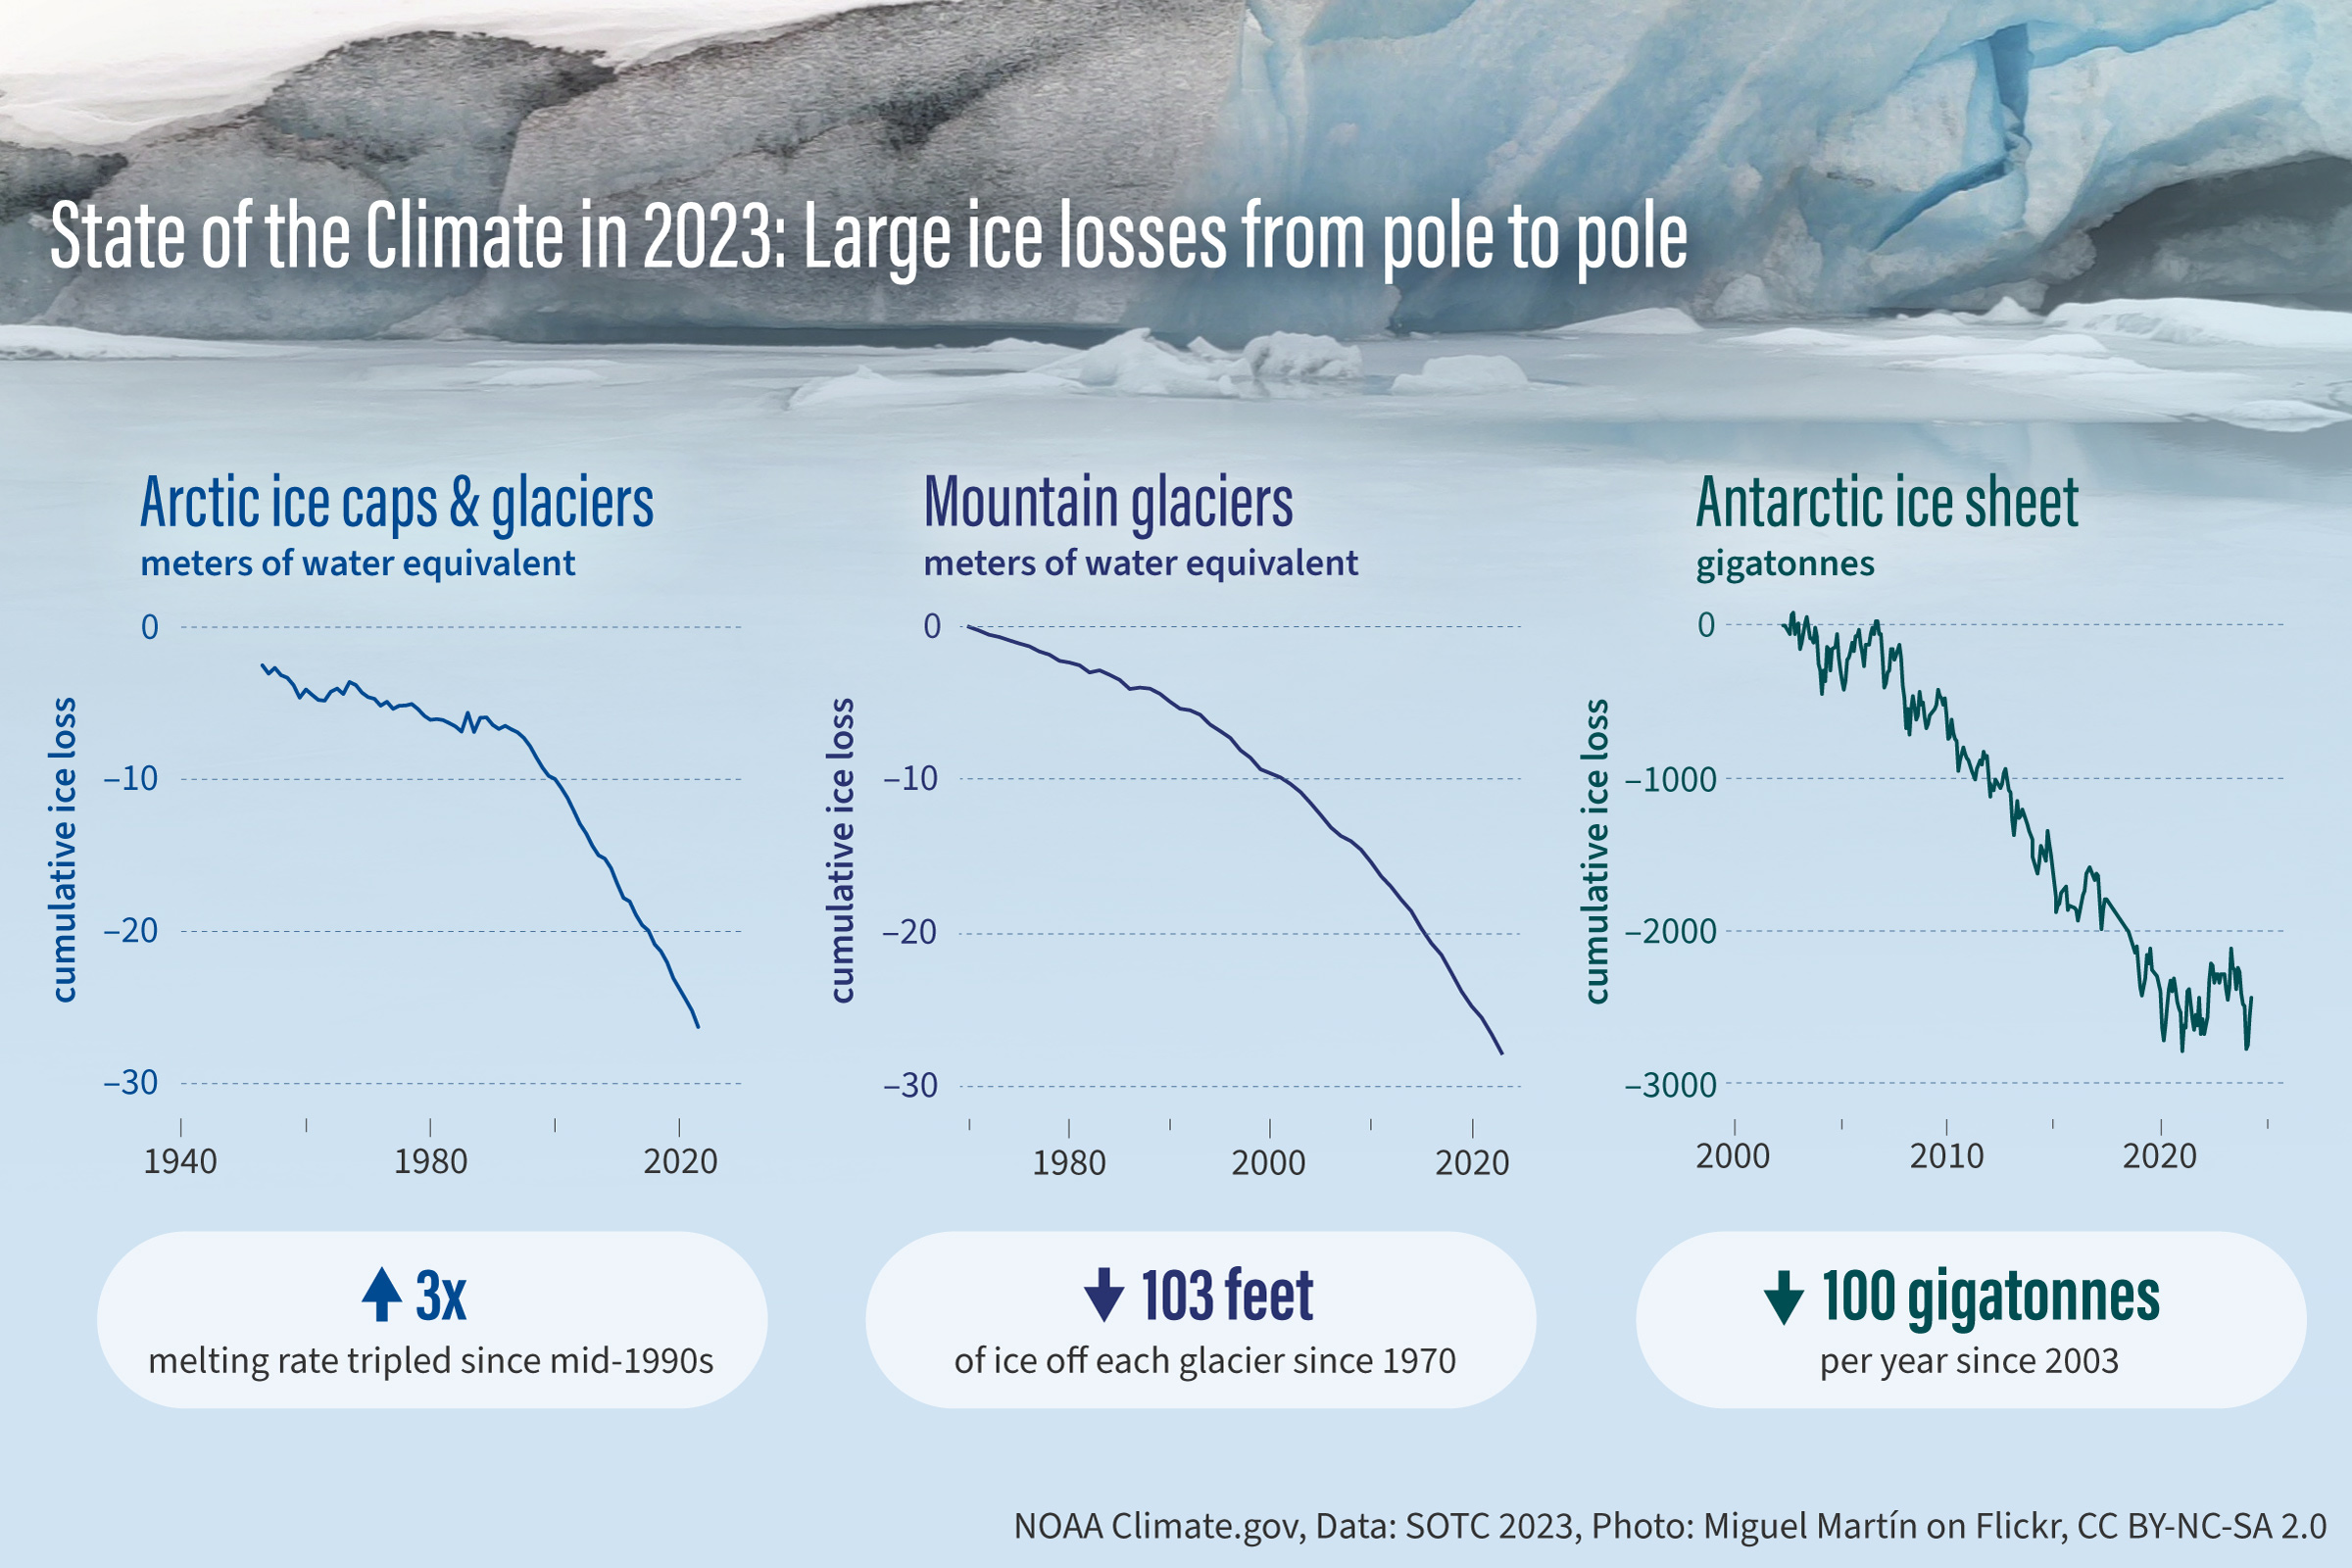
This trio of line graphs shows ice loss over time from three different environments: (left) Arctic glaciers and ice caps (outside of Greenland), (center) mountain glaciers worldwide, and (right) the Antarctic Ice Sheet. From pole to pole and everywhere in between, Earth's ice is disappearing. NOAA Climate.gov image, adapted from Figures 5.22, 2.17, and 6.10a in State of the Climate in 2023. Photo by Miguel Martín, used under a Creative Commons license.
The international annual review of the world’s climate, led by scientists from NOAA’s National Centers for Environmental Information and published by the Bulletin of the American Meteorological Society (BAMS), is based on contributions from more than 590 scientists in nearly 60 countries. It provides the most comprehensive update on Earth’s climate indicators, notable weather events and other data collected by environmental monitoring stations and instruments located on land, water, ice and in space.

Ice Worm Glacier in the North Cascade mountains of Washington, United States, which was under
continuous annual monitoring from 1984 onward and disappeared in 2023. Large photo: The
location of former Ice Worm Glacier on August 13, 2023. Inset photo: Ice Worm Glacier on August 16, 1986. Photos by Mauri Pelto.
“The BAMS State of the Climate report is the product of an international effort to more fully understand global climate conditions in 2023,” said NCEI Director Derek Arndt. “This report documents and shares a startling, but well established picture: We are experiencing a warming world as I speak, and the indicators and impacts are seen throughout the planet. The report is another signpost to current and future generations.”
Notable findings from the international report
Earth’s greenhouse gas concentrations were the highest on record.
Carbon dioxide, methane and nitrous oxide—Earth’s major atmospheric greenhouse gases—once again reached record high concentrations in 2023. Annual growth in global mean CO2 has increased from 0.6±0.1 ppm yr−1 in the early 1960s to an average of 2.5 ppm yr−1 during the last decade of 2014–23. The growth from 2022 to 2023 was 2.8 ppm, the fourth highest in the record since the 1960s.
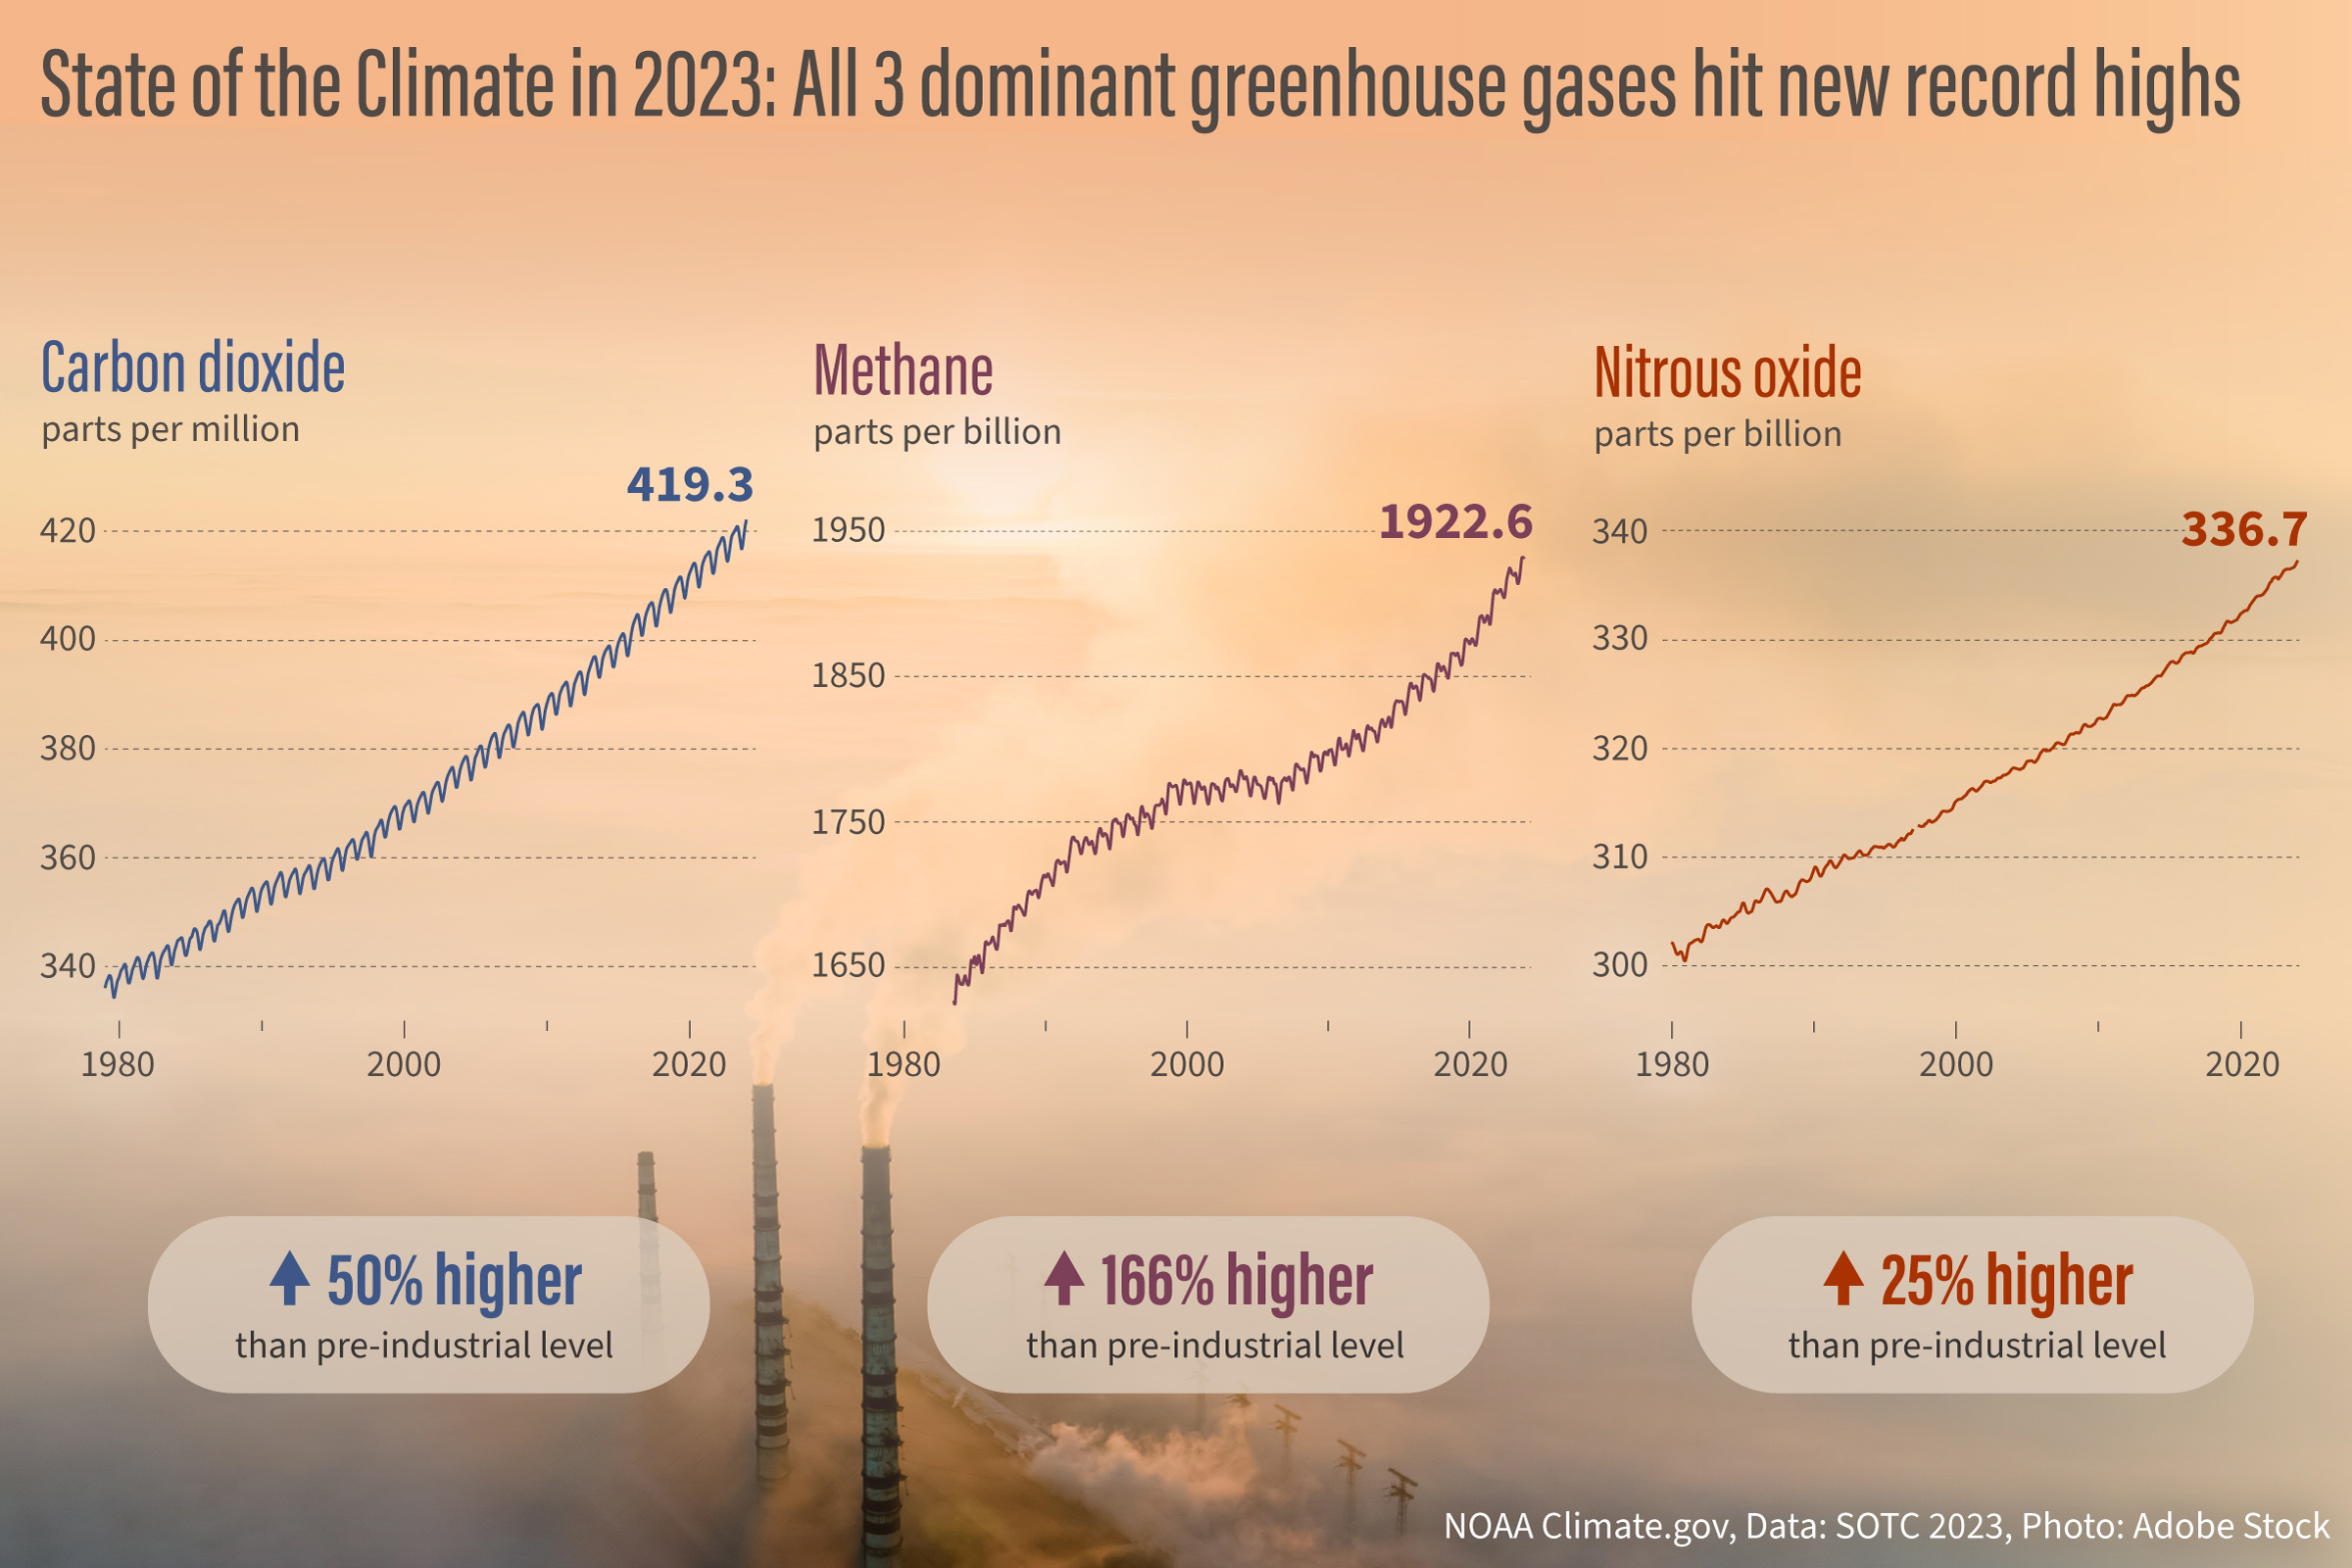
The three dominant greenhouse gases in Earth's atmosphere—carbon dioxide (left), methane (center), and nitrous oxide (right)—all reached new highs in 2023. NOAA Climate.gov image, adapted from Figure 2.59 in State of the Climate in 2023. Background photo from Adobe Stock.
Record temperatures notable across the globe.
A range of scientific analyses indicate that the annual global surface temperature was 0.99 to 1.08 of a degree F (0.55 to 0.60 of a degree C) above the 1991–2020 average. This makes 2023 the warmest year since records began in the mid to late 1800s, surpassing the previous record of 2016 by 0.23 to 0.31 of a degree F (0.13 to 0.17 of a degree C). The transition in the Pacific Ocean from La Niña at the beginning of the year to a strong El Niño by the end of the year contributed to the record warmth. All seven major global temperature datasets used for analysis in the report agree that the last nine years (2015–23) were the nine warmest on record. The annual global mean surface temperature has increased at an average rate of 0.14 to 0.16 of a degree F (0.08 to 0.09 of a degree C) per decade since 1880, and at a rate more than twice as high since 1981.
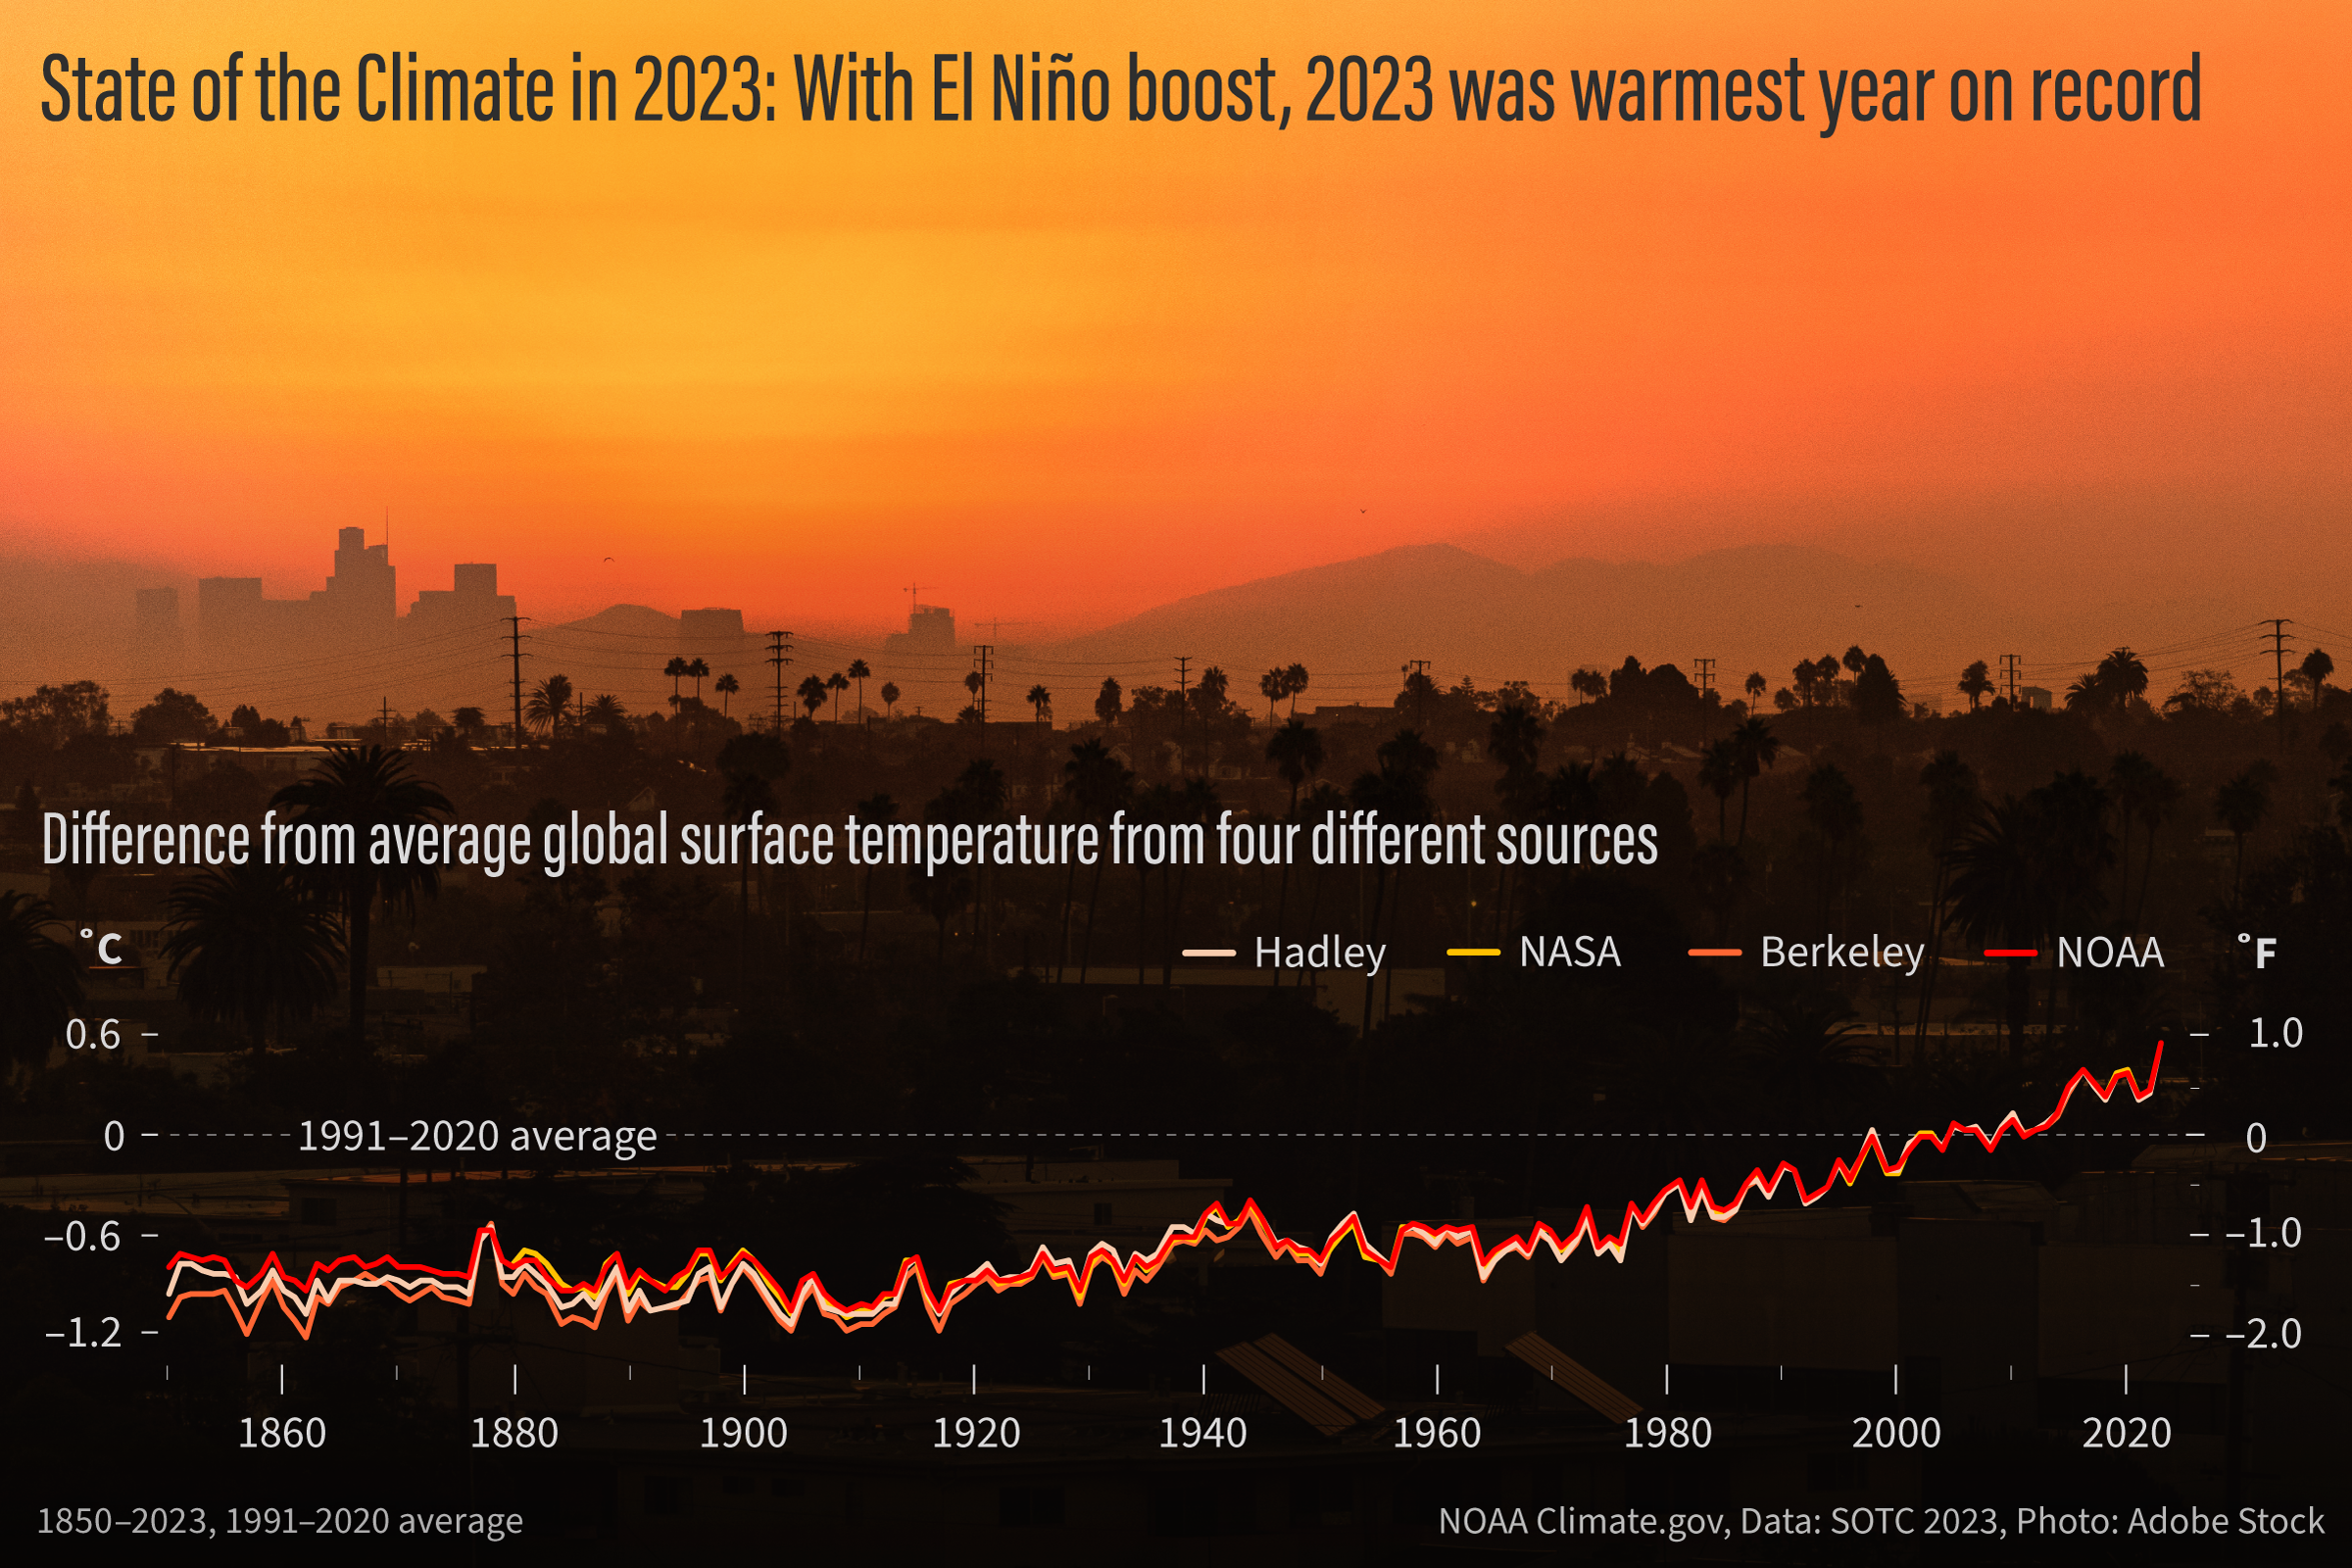
Graphs of yearly global surface temperature compared to the 1991-2020 average from 1850 to 2023, based on data from four different sources: NOAA, NASA, the U.K. Met Office Hadley Center, and Berkeley Earth. Despite small differences among the records from year to year, all show our planet's warming trend, ending with a new record high temperature in 2023. NOAA Climate.gov image, adapted from Figure 2.1a in State of the Climate in 2023. Background photo from Adobe Stock.
El Niño conditions contributed to record-high sea surface temperatures.
El Niño conditions in the equatorial Pacific Ocean emerged in boreal spring 2023 and strengthened throughout the year. The mean annual global sea-surface temperature in 2023 was record high, surpassing the previous record of 2016 by 0.23 of a degree F (0.13 of a degree C). Each month from June to December was record warm. On August 22, an all-time high globally averaged daily sea-surface temperature of 66.18 degrees F (18.99 degrees C) was recorded.
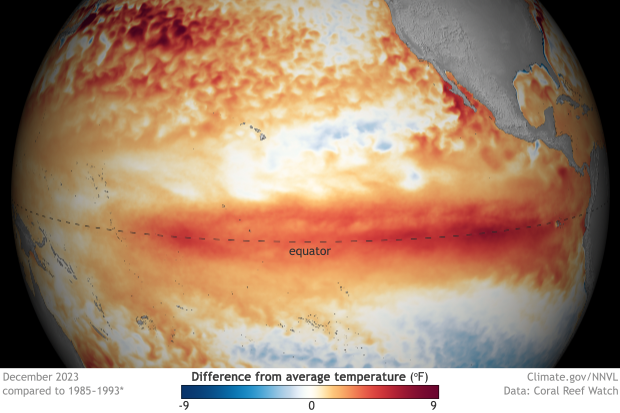
Surface temperatures in the tropical Pacific Ocean in December 2023 compared to average (1985-1993) showing the swath of warmer-than-average waters across the equatorial Pacific near the peak of El Niño. NOAA Climate.gov image from our Data Snapshots collection, based on Coral Reef Watch data from NOAA View.
Approximately 94 percent of the ocean surface experienced at least one marine heatwave in 2023, which is defined as sea-surface temperatures in the warmest 10 percent of all recorded data in a particular location on that day for at least five days. The eastern tropical and North Atlantic Ocean, the Sea of Japan, the Arabian Sea, the Southern Ocean near New Zealand, and the eastern tropical Pacific, were in a marine heatwave state for at least 10 months of 2023. The ocean experienced a new global average record of 116 marine heatwave days in 2023, which was far more than the previous record of 86 days in 2016, and a new record of 13 marine cold spell days, far below the previous record of 37 days in 1982.
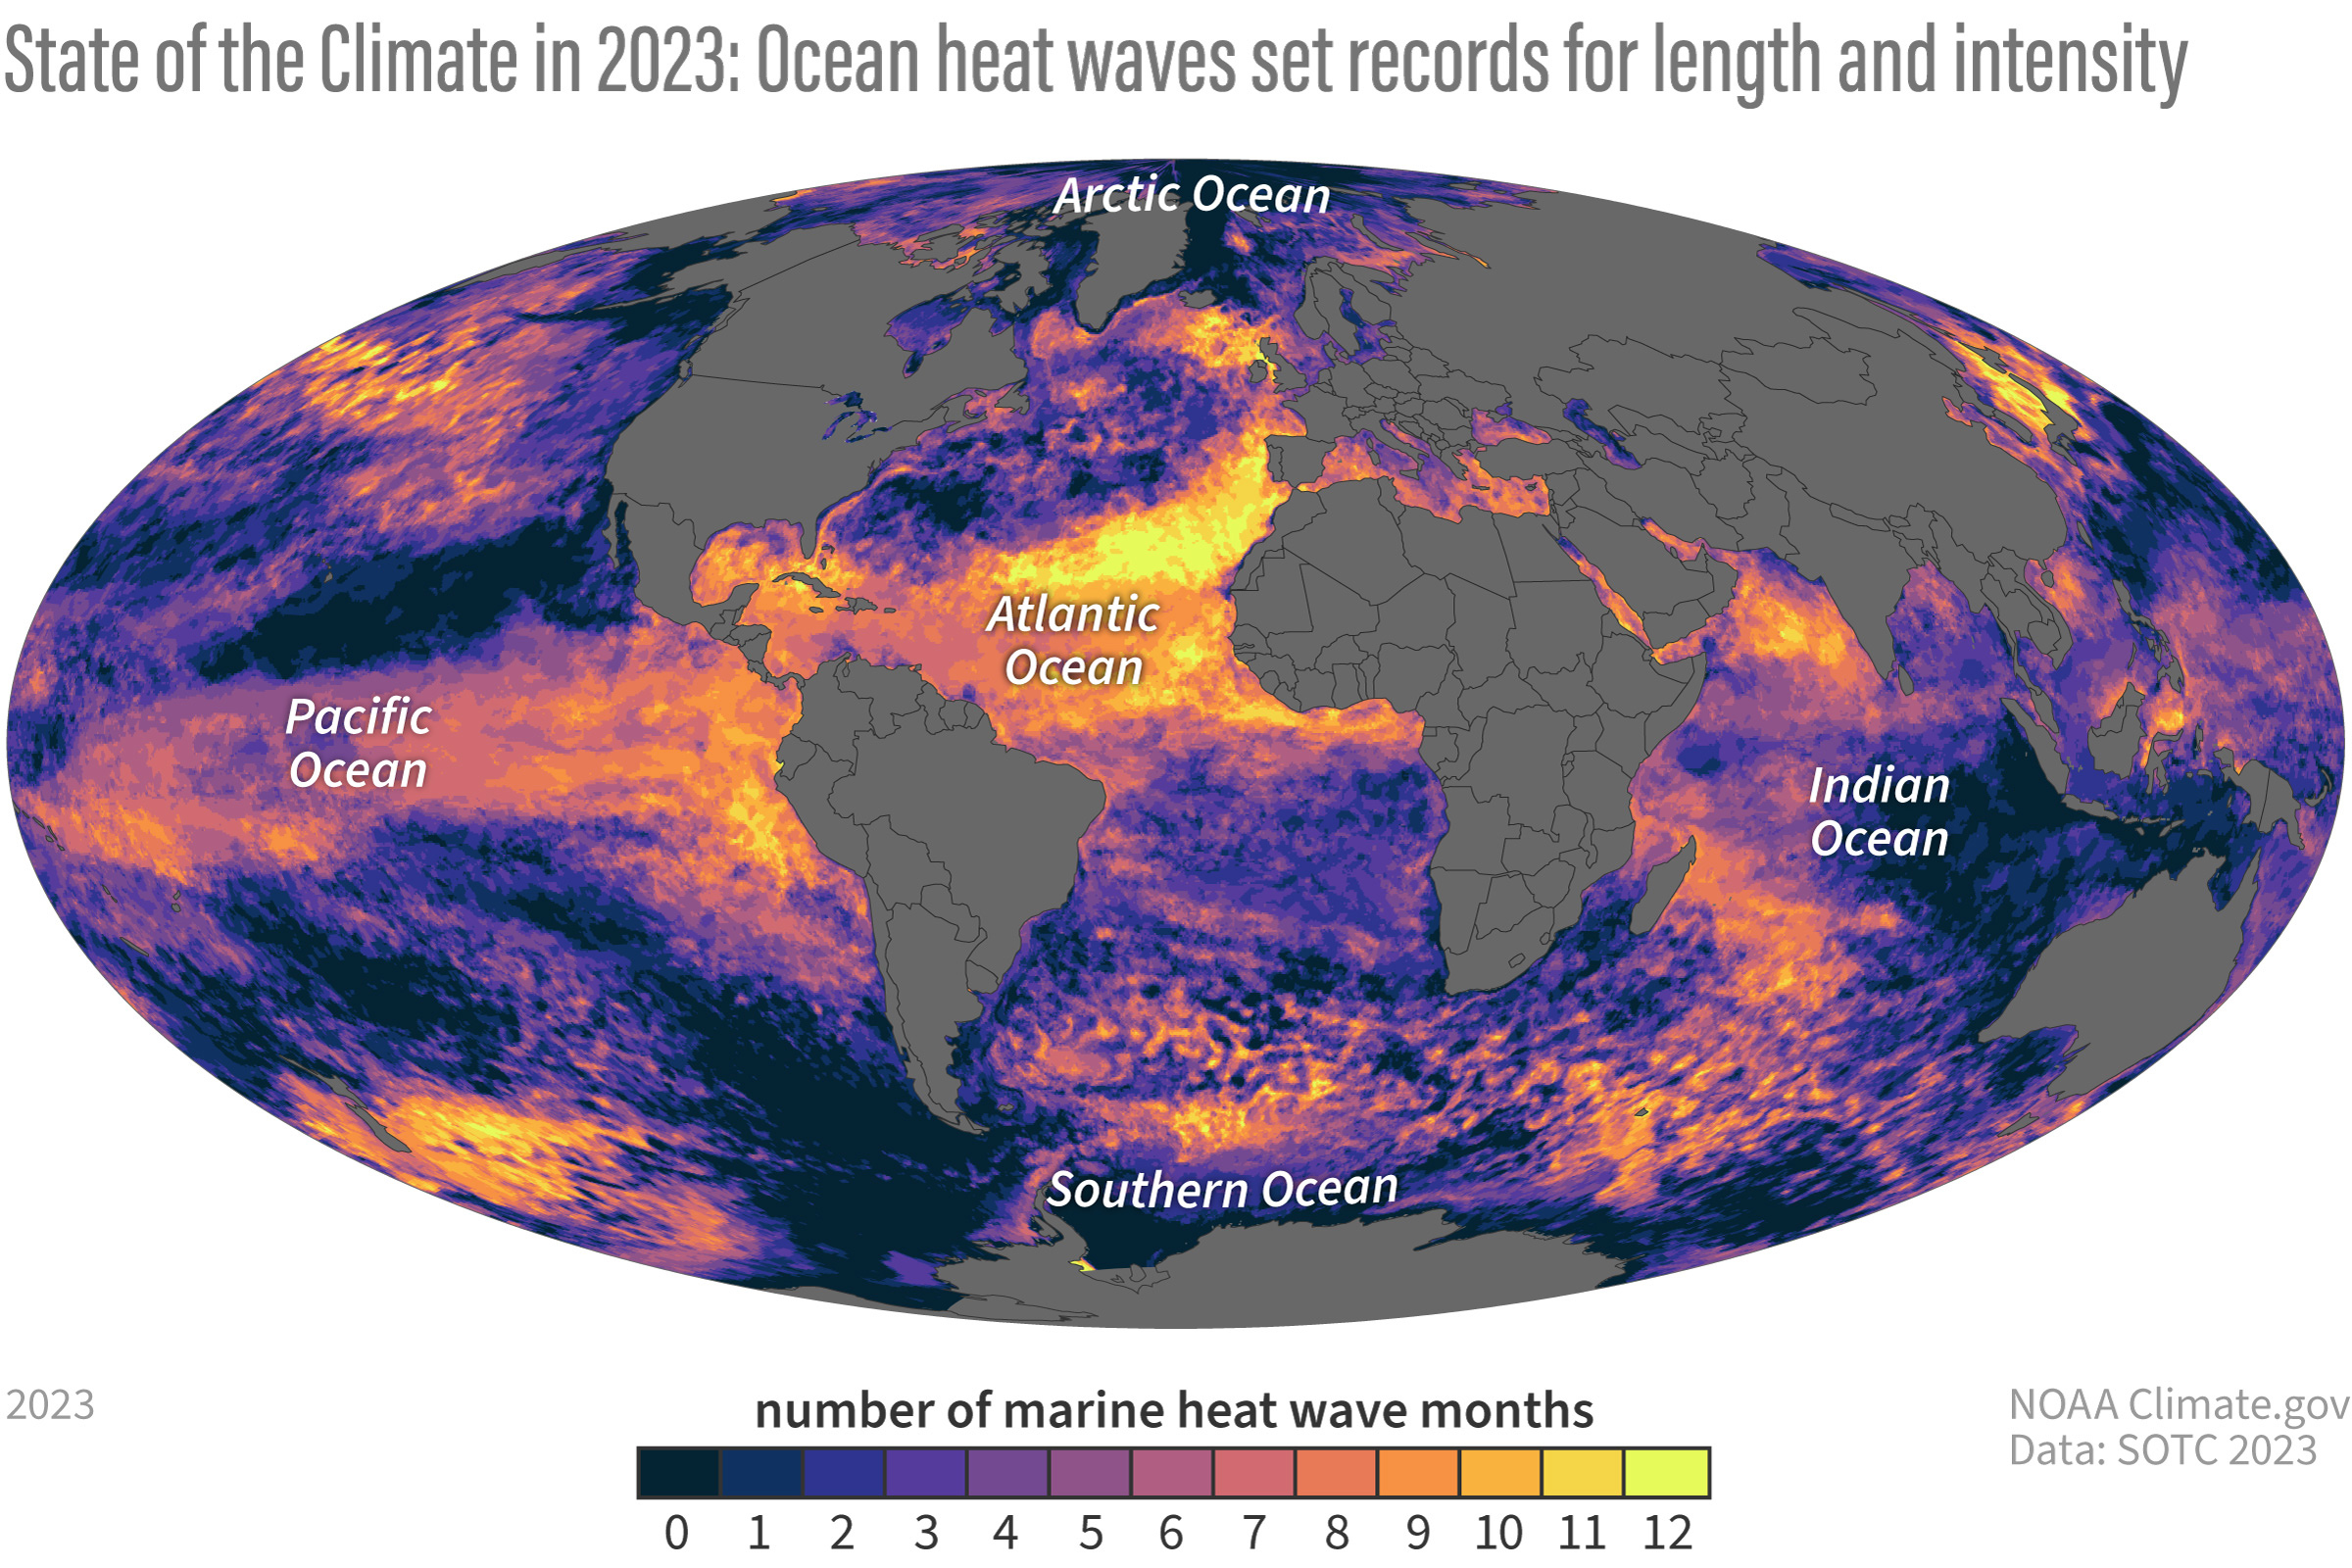
This map shows the number of months each part of the global ocean experienced heat wave conditions in 2023, meaning that for a given time of year, the monthly average temperatures were in the hottest 10 percent of all monthly temperatures from 1991-2020. Very few areas experienced less than one full month of heat wave conditions (darkest blue). Relatively large swaths of the eastern North Atlantic experienced heat wave conditions virtually all year (bright yellow). NOAA Climate.gov image, adapted from Figure SB3.1 in State of the Climate in 2023.
Ocean heat and global sea level were the highest on record.
Over the past half-century, the oceans have stored more than 90 percent of the excess energy trapped in Earth’s system by greenhouse gases and other factors. The global ocean heat content, measured from the ocean’s surface to a depth of 2000 meters (over 6,500 feet), continued to increase and reached new record highs in 2023. Global mean sea level was record high for the 12th-consecutive year, reaching about 4.0 inches (101.4 millimeters) above the 1993 average when satellite altimetry measurements began. This rise is an increase of 0.3±0.1 of an inch (8.1±1.5 millimeters) over 2022, the third highest year-over-year increase on record.
Heatwaves and droughts contributed to massive wildfires around the world.
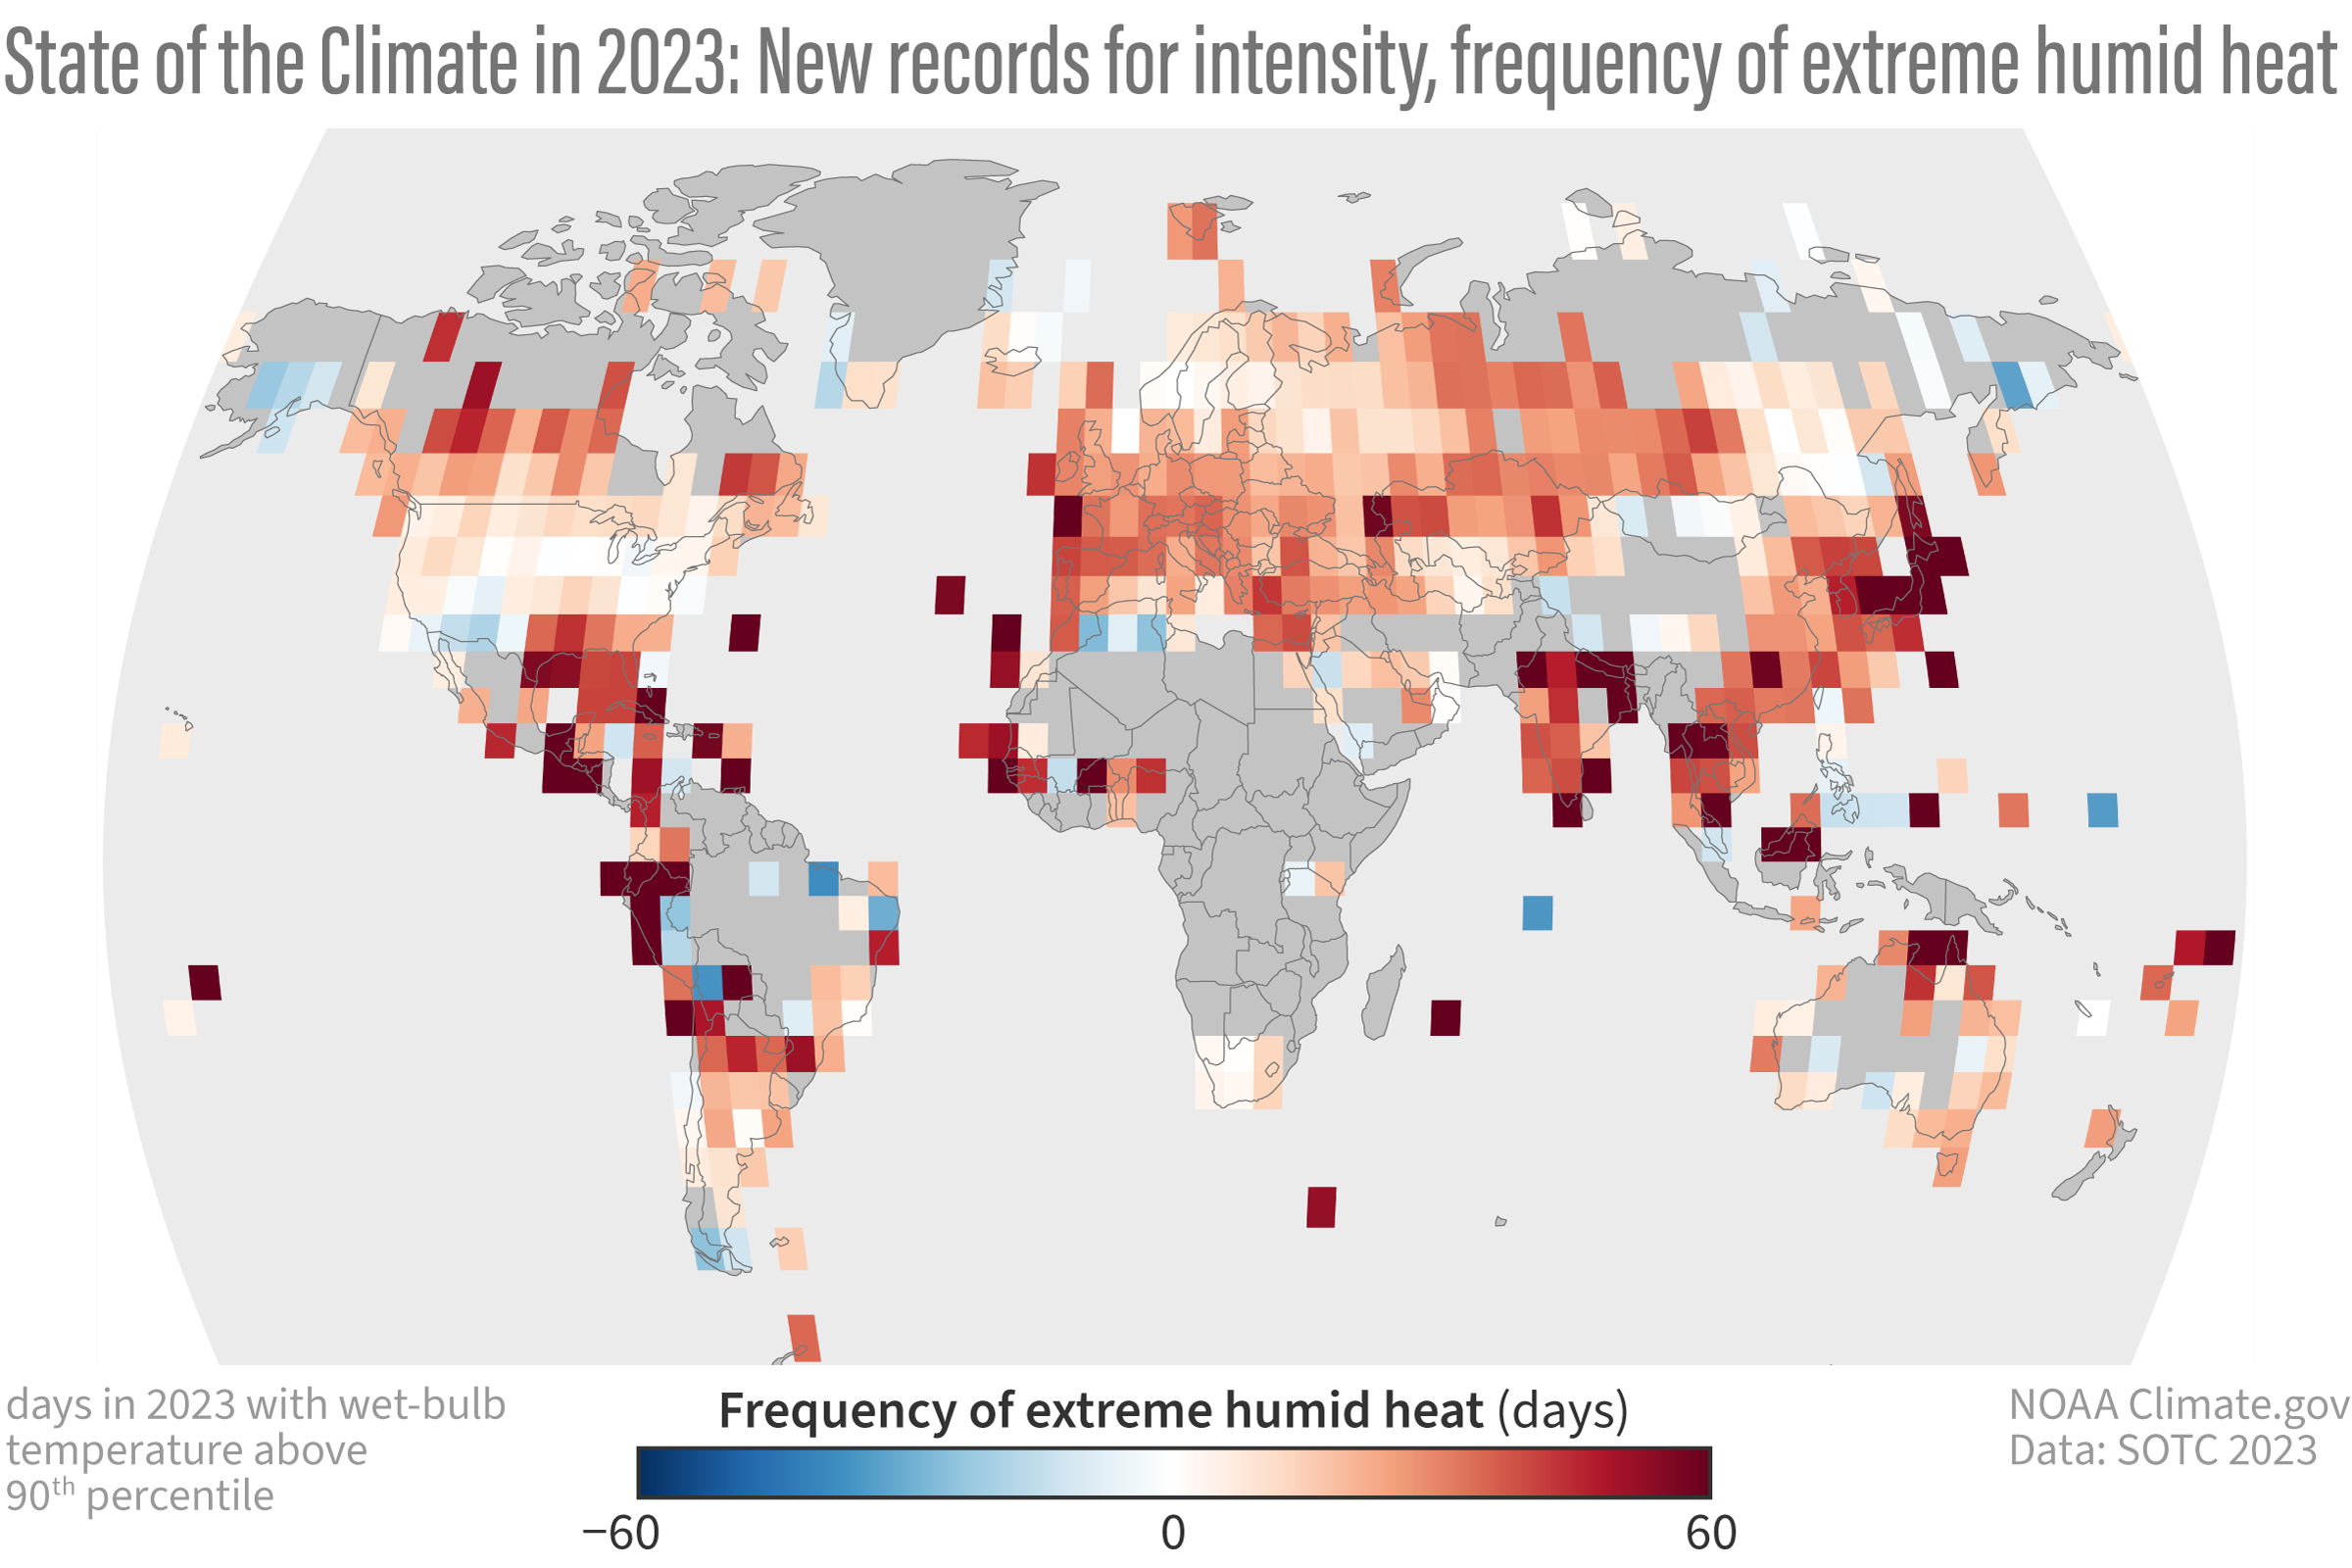
This map shows the frequency of extreme humid heat worldwide in 2023 compared to the 1991-2023 average. Extreme humid heat is defined as a day when the maximum wet-bulb temperature is in the highest 10 percent on record from 1991-2020. The map compares the frequency of these days in 2023 to their normal frequency at that location from 1991-2020. Places that are darkest red experienced 60 or more days of extreme humid heat—2 months—more than average. Places where the frequency of extreme humid heat was less than average are colored blue. NOAA Climate.gov image, adapted from State of the Climate in 2023, Plate 2.1(i).
During late spring and a record-warm summer, approximately 37 million acres burned across Canada, an area more than twice the size of Ireland and more than double the previous record from 1989. Approximately 232,000 people were evacuated due to the threat of wildfires, and smoke from the wildfires impacted regions across Canada and also affected the heavily populated cities of New York City and Chicago, and even areas of western Europe. With August to October 2023 being the driest three-month period in Australia in the record dating to 1900, millions of acres of bushfires burned for weeks in the Northern Territory during September and October. From mid-August to early September, the largest wildfire since the start of the record in 2000 for the European Union burned in the Alexandroupolis municipality of Greece. The fire burned almost 232,000 acres. Overall, the total area burned in Greece in 2023 was more than four times its long-term average.
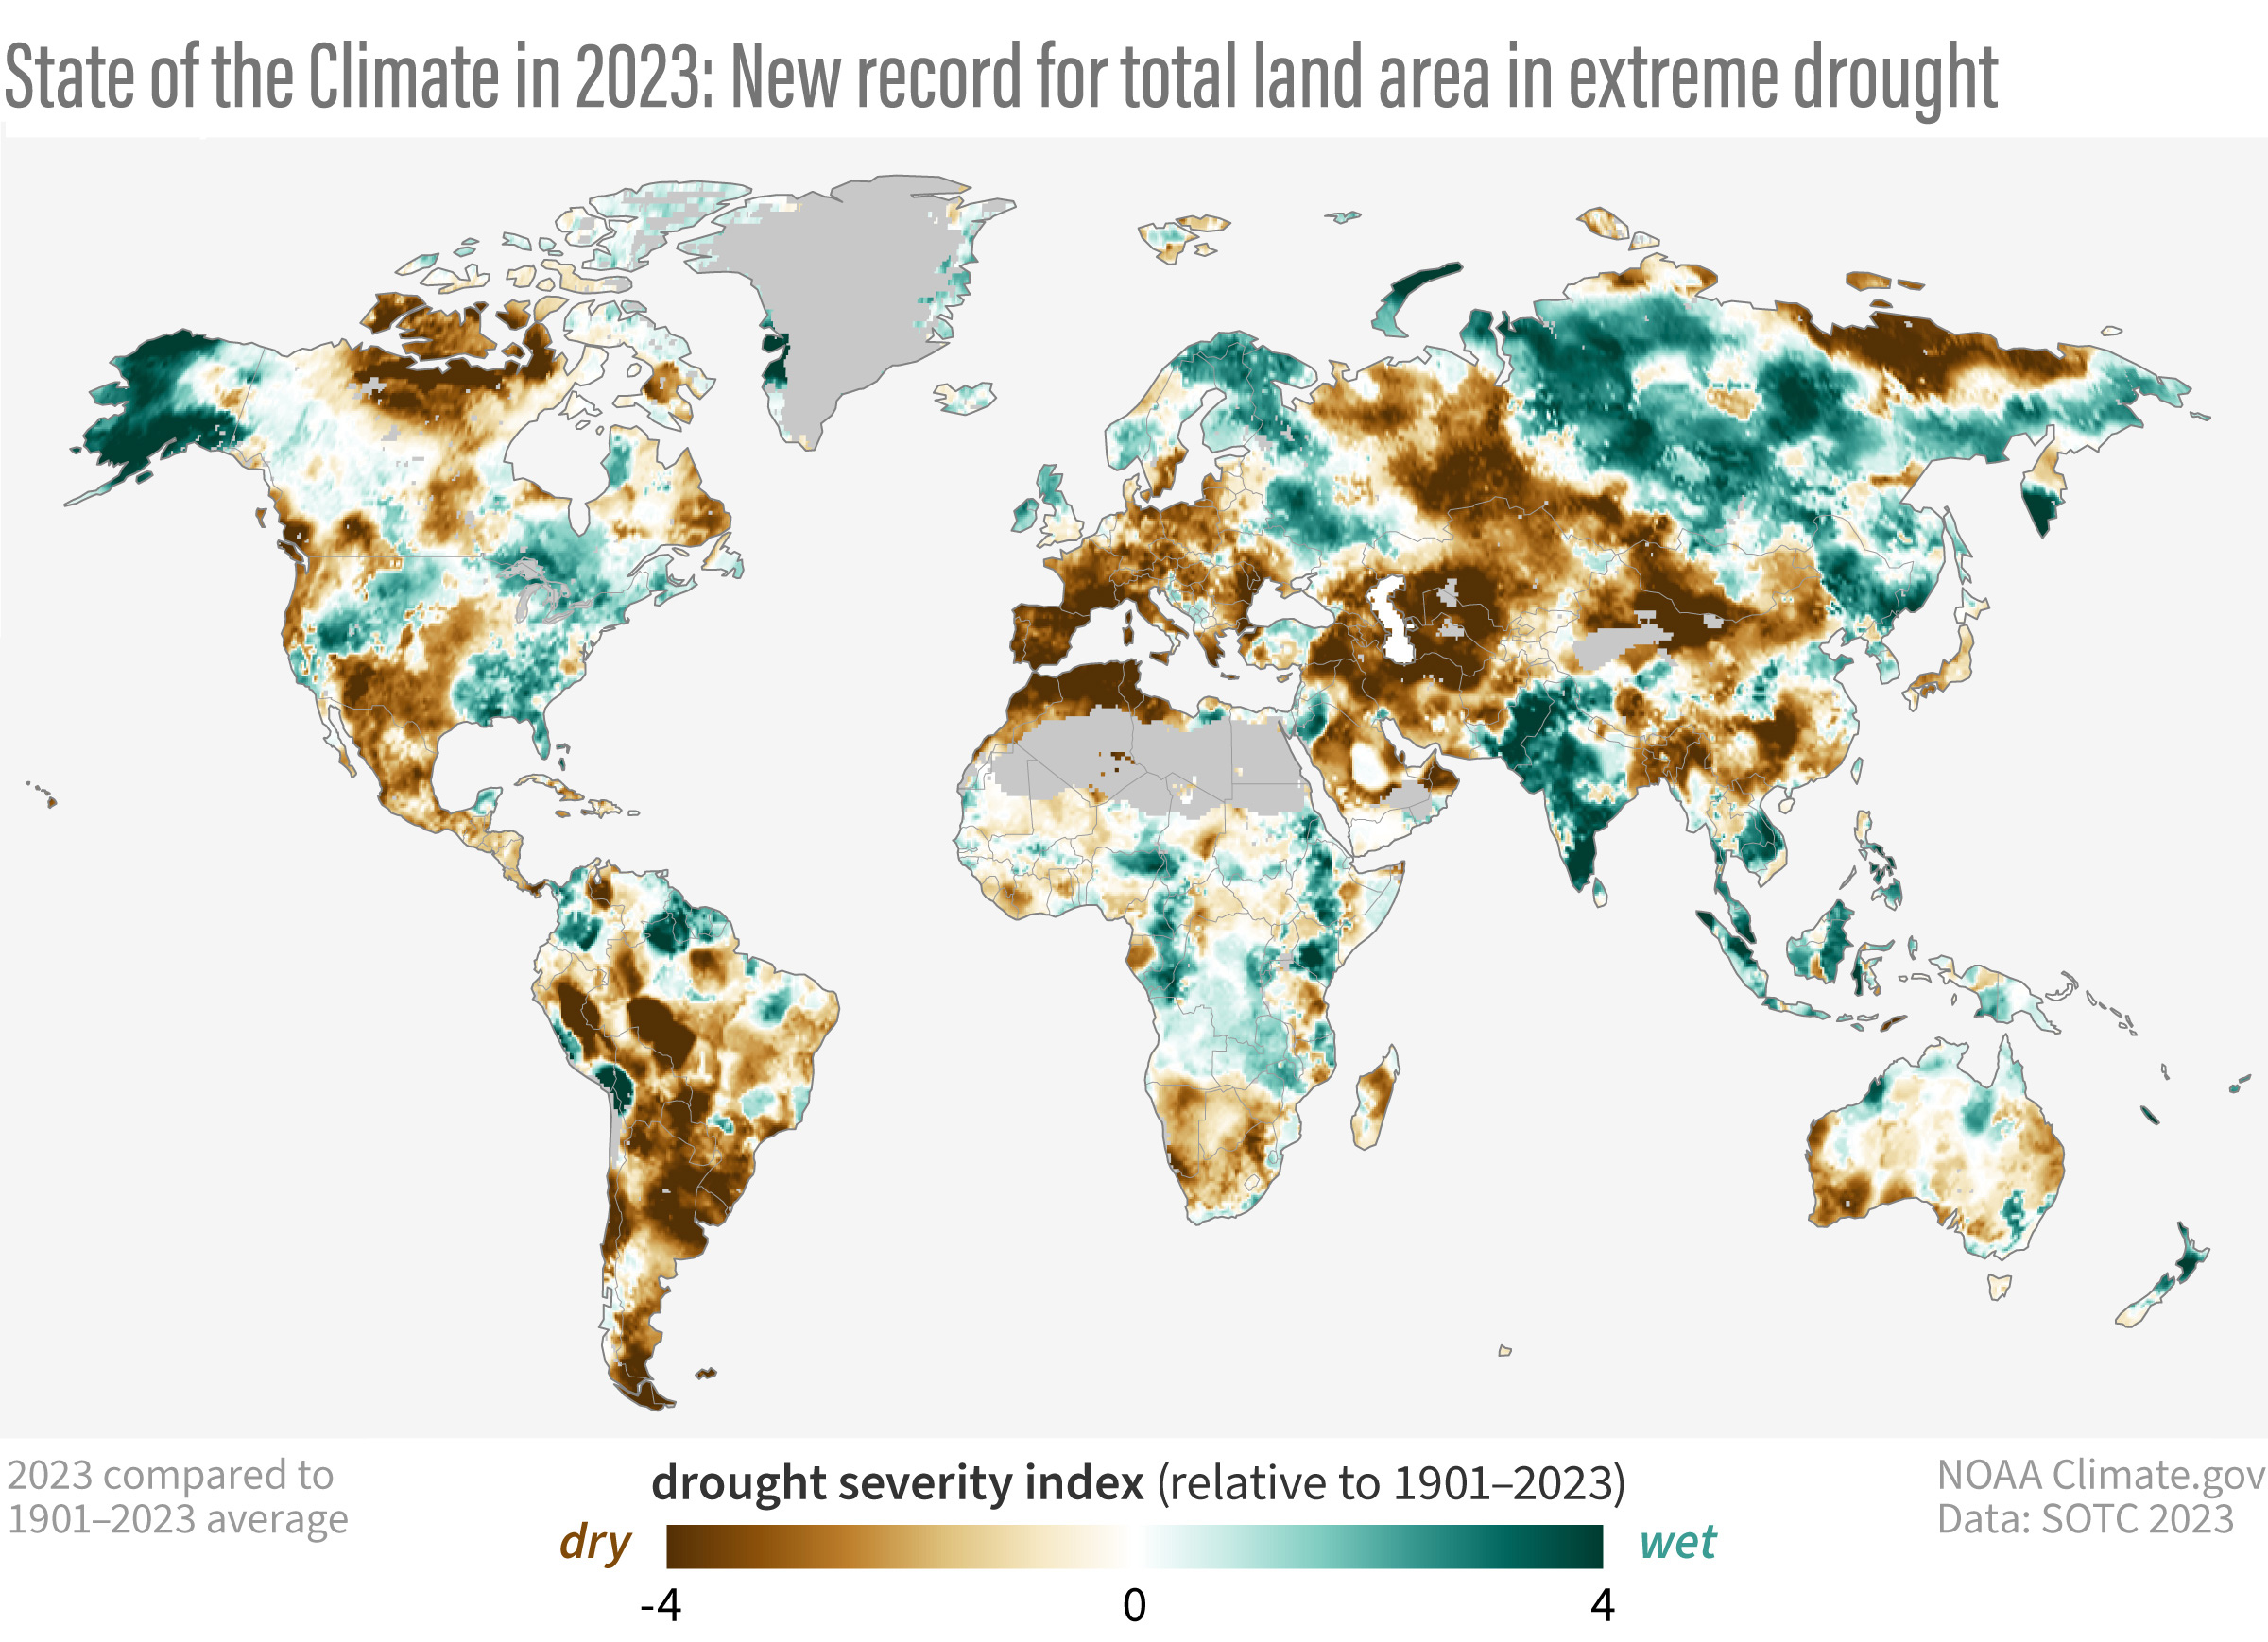
This map shows global drought status in 2023 based on a scale called the Palmer Self-calibrating Drought Index. Areas experiencing the most extreme drought are darkest brown; places that were extremely wet over the year are colored dark blue green. Nearly 8 percent of the global land area experienced extreme drought in 2023—a new record. NOAA Climate.gov image, adapted from State of the Climate in 2023, Plate 2.1(s).
The Arctic was warm and navigable.
The Arctic had its fourth-warmest year in the 124-year record, with summer (July to September) record warm. Below-ground, permafrost temperatures were the highest on record at over half of the reporting sites across the Arctic. Permafrost thaw disrupts Arctic communities and infrastructure and can also affect the rate of greenhouse gas release to the atmosphere, potentially accelerating global warming. The seasonal Arctic minimum sea-ice extent, typically reached in September, was the fifth-smallest in the 45-year record. The amount of multiyear ice—ice that survives at least one summer melt season in the Arctic—continued to decline. Since 2012, the Arctic has been nearly devoid of ice that is more than four years old.
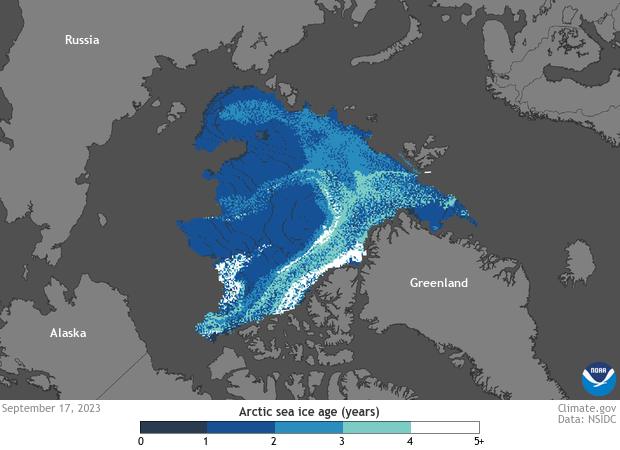
Very little ice older than 4 years (white) remains in the Arctic today. The year-round ice pack is younger, thinner, and more vulnerable to melting during the summer. NOAA Climate.gov image from our Data Snapshots collection, based on data from National Snow and Ice Data Center.
Both the Northern Sea Route and Northwest Passage became accessible to non-ice-hardened marine traffic. The Northern Sea Route, connecting the European Arctic to the Pacific Ocean via the north coast of Russia and Bering Strait, saw 75 ship transits in the 2023 open season, the second-highest number of ships on record. The Northwest Passage, which connects the Atlantic Ocean to the Pacific via northern Canada and Alaska waters, saw a record number of ship passages. A total of 42 ships made the complete Northwest Passage transit, far surpassing the previous record of 33 ships in 2017.
Antarctica sea ice sets record lows throughout 2023.
Eight months saw new monthly mean record lows in sea ice extent and sea ice area, and 278 days in 2023 set new daily record-low sea ice extents. On February 21, Antarctic sea ice extent and sea ice area both reached all-time record lows, surpassing the previous record lows that were set just a year earlier in February 2022. On July 6, a new record-low daily sea ice extent was 695,000 square miles (1.8 million square kilometers) lower than the previous record low for that day.
Daily ice extent around Antarctic in 2023 to date (dark red) compared to all years from 1979–2012 (light gray), years from 2013–2015 (blue), and years from 2016–2022 (light red). The annual winter maximum ice extent around Antarctica has been highly variable in the past decade, with some years above average and others below average. The 2023 record low, however, is far outside the range of previous natural variability. Animation by National Snow and Ice Data Center.
Tropical cyclone activity was below average, but storms still set records around the globe.
There were 82 named tropical storms during the Northern and Southern Hemisphere storm seasons last year, which was below the 1991–2020 average of 87. Seven tropical cyclones reached Category 5 intensity on the Saffir–Simpson Hurricane Wind Scale. Globally, the accumulated cyclone energy—a combined measure of the strength, frequency, and duration of tropical storms and hurricanes—rebounded from the lowest in the 43-year record in 2022 to above average in 2023. Typhoon Doksuri (named Egay in the Philippines) caused $18.4 billion U.S. dollars in economic losses in the northern Philippines and China. Beijing received 744.8 mm of rain from remnants of the storm in a 40-hour period, which was the city’s heaviest rainfall in its 140-year record and caused floods that killed 137 residents. Tropical Cyclone Freddy became the world’s longest-lived tropical cyclone on record, developing into a tropical cyclone on February 6 and finally dissipating on March 12. Freddy crossed the full width of the Indian Ocean and made three landfalls in total: one in Madagascar and two in Mozambique. In the Mediterranean—outside of traditional tropical cyclone basins—heavy rains and flooding from Storm Daniel killed more than 4,300 people and left more than 8,000 missing in Libya.
The State of the Climate report is a peer-reviewed series published annually as a special supplement to the Bulletin of the American Meteorological Society. The journal makes the full report openly available online. NCEI’s high-level overview report is also available online.