Global climate summary for July 2024
Highlights
- Temperatures were above average over much of the globe with Africa, Europe and Asia having their warmest July on record.
- Sea surface temperatures were second-warmest on record, ending a streak of 15 consecutive record-setting months.
- Northern Hemisphere snow cover extent and global sea ice extent were both below average, with Antarctic ice coverage ranking second smallest.
- Global tropical cyclone activity was below average with seven named storms, including two in the Atlantic Basin.
July temperature
July 2024 was the warmest July on record for the globe in NOAA's 175-year record. The July global surface temperature was 1.21°C (2.18°F) above the 20th-century average of 15.8°C (60.4°F). This is 0.03°C (0.05°F) warmer than the previous July record set last year, and the 14th consecutive month of record-high global temperatures. This breaks the longest record warm global temperature streak in the modern record (since 1980) previously set from May 2015—May 2016. July 2024 marked the 48th consecutive July with global temperatures, at least nominally, above the 20th-century average.
There have been 14 consecutive months of record-hot global temperatures, spanning from June 2023 through July 2024. This breaks the previous record (May 2015 through May 2016) for longest record-warm global temperature streak in modern record (since 1980). Each month of record global temperatures, compared to the 1991-2020 average, is shown in sequence. Places that were warmer than average are red; places that were cooler than average are blue. Image by NOAA Climate.gov, based on data from NOAA National Centers for Environmental Information.
Climatologically, July is the warmest month of the year. As the warmest July on record, July 2024 was more likely than not the warmest month on record for the globe since 1850. The past ten Julys have been the warmest Julys on record.
The global land-only July temperature also was warmest on record at 1.70°C (3.06°F) above average. The ocean-only temperature was second-warmest at 0.98°C (1.76°F) above average, ending a streak of 15 consecutive monthly record highs that stretched from April 2023—June 2024. These temperatures occurred under ENSO-neutral conditions. According to NOAA's Climate Prediction Center, ENSO-neutral is expected to continue for the next several months, with La Niña favored to emerge during September-November (66% chance) and persist through the Northern Hemisphere winter 2024-25 (74% chance during November-January).
Record-warm July temperatures covered large parts of northern and southern Africa, southeastern Europe and large parts of Asia, as well as areas of the western U.S. and western Canada. In North America areas of anomalous warmth stretched from northwest Mexico through much of the western U.S., the northern Plains and states on the Eastern Seaboard, as well as much of Canada, where anomalies greater than 3.0°C (5.4°F) were widespread. Much-warmer-than-average to record July temperatures covered most all of Greenland, where temperatures were more than 4°C (7.2°F) above average in many places. During July 2024, 13.8% of the world's surface had a record-high July temperature, exceeding the previous July record set in 2023 by 5.4%. Close to one-fifth (19.2%) of the global land surface had a record-high July temperature. Meanwhile, 0.3% of the global land and ocean surface experienced a record-cold July temperature.
In South America temperatures were warmer than average from southern Brazil through northern parts of the continent and Central America. However, Argentina and neighboring countries had cooler than average July mean temperatures. Cold air outbreaks from Antarctica brought periods of extremely cold daily temperatures, resulting in wildlife deaths associated with the anomalous weather. Other areas with cooler-than-normal temperatures in July included large parts of central and eastern Australia, the Russian Far East, parts of southern Africa, much of Alaska and parts of the central U.S.
The cold outbreaks in southern South America were associated with a weak polar vortex over Antarctica that allowed cold air to move northward during the month. Over Antarctica, particularly central and eastern areas, the weak polar vortex led to extremely warm daily temperatures during the latter part of the month, as the northward surging cold air was replaced by widespread occurrences of daily temperatures more than 10°C (18°F) above average. For the month-as-a-whole, temperatures more than 4°C (7.2°F) above average covered large parts of the Antarctic continent, and for the Antarctic region as a whole, the month tied July 1991 as the fifth warmest July on record.
Other areas with anomalous warmth included a region that stretched from Southwest Asia through most of China and Mongolia into central Russia. In parts of the Persian Gulf region, heat indices reached extreme levels in July as mid-summer temperatures exceeding 40.5°C (105°F) and Gulf water temperatures above 32°C (90°F) brought a combination of high humidity and heat that produced feels-like temperatures of 60°C (140°F) and higher. The heat index in Dubai climbed as high as 62°C (143°F to 144°F), as water temperatures in the Gulf reached the mid-30s°C (mid-90s°F). Global hourly observations showed a heat index near 69°C (149°F) at the Persian Gulf International airport in Asaluyeh on July 17.
In eastern Europe monthly mean temperatures more than +2°C (+3.6°F) warmer-than-average were widespread and the July mean temperature was more than 1°C (1.8°F) above average in much of southern Europe. In Spain and other countries along the Mediterranean, July heat waves brought multi-day temperatures exceeding 38°C (100°F). This led to severe wildfire conditions in some areas and reports of hundreds of heat-related deaths. Temperatures were even hotter in Morocco, where daily high temperatures exceeded 41°C (106°F) in many locations. Researchers from World Weather Attribution found that the severity of the heatwave in this region would not have been possible in the absence of climate change.
Over the global oceans record-warm July temperatures covered large parts of the equatorial and northern Atlantic, although the expanse of record-breaking temperatures was less than in recent months. The Caribbean continued to be record warm in July. Across the global ocean, 11.3% of its surface had a record-high temperature for the month. Only 0.05% of the global ocean was record cold in July. Widespread areas of below-average July sea surface temperatures were largely confined to the southeastern Pacific and adjacent areas of the Southern Ocean. Areas of the far northern Pacific also were cooler than average for July.
In the Northern Hemisphere, July 2024 also was warmest on record at 1.51°C (2.72°F) above average. This is 0.01°C (0.02°F) warmer than July 2023. The Northern Hemisphere land temperature also ranked warmest on record for the month, while the Northern Hemisphere Ocean temperature was second warmest for July. The Southern Hemisphere also experienced its warmest July on record at 0.91°C (1.64°F) above average, 0.05°C (0.09°F) warmer than 2023. The Southern Hemisphere land temperature and ocean temperature for July were both individually second warmest on record.
July precipitation from land-based stations
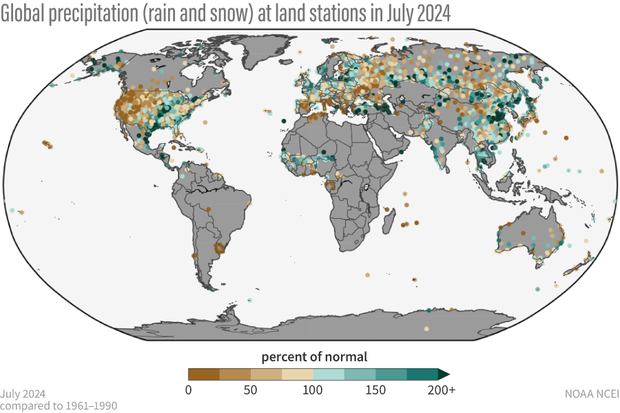
Percent of normal precipitation for global land-based stations in July 2024 compared to a base line of 1961 to 1990. Places that received more precipitation than average are colored green; places that received less precipitation than average are colored brown. Gray areas represent missing data. Image by NOAA Climate.gov, based on data from NOAA National Centers for Environmental Information.
July was drier-than-average in areas that included most of the western contiguous U.S. and Hawaii, much of southern Europe and eastern Europe, parts of central Asia, and much of northern and western Australia. Areas that were wetter-than-average included much of the state of Alaska, a large part of the central U.S. and parts of the southeastern U.S., western and northern Europe, a large part of central Asia and southeast Asia including India, eastern Afghanistan and northern Pakistan, parts of central and south-central Australia, and much of the Sudanian savanna of Western Africa.
For information on 2024's year-to-date temperature ranking, notable climate events, and separate statistics for Earth's land and ocean areas see the full July 2024 monthly report from NOAA NCEI.
Satellite summary of global precipitation patterns for July
Headlines
- Near-neutral July ENSO [El Niño-Southern Oscillation] conditions associated with precipitation patterns somewhat resembling the global precipitation trend (1983-2024) pattern.
- Floods and landsides were associated with heavy rain in India and Ethiopia.
- Tropical cyclones led to flooding in Taiwan and Houston.
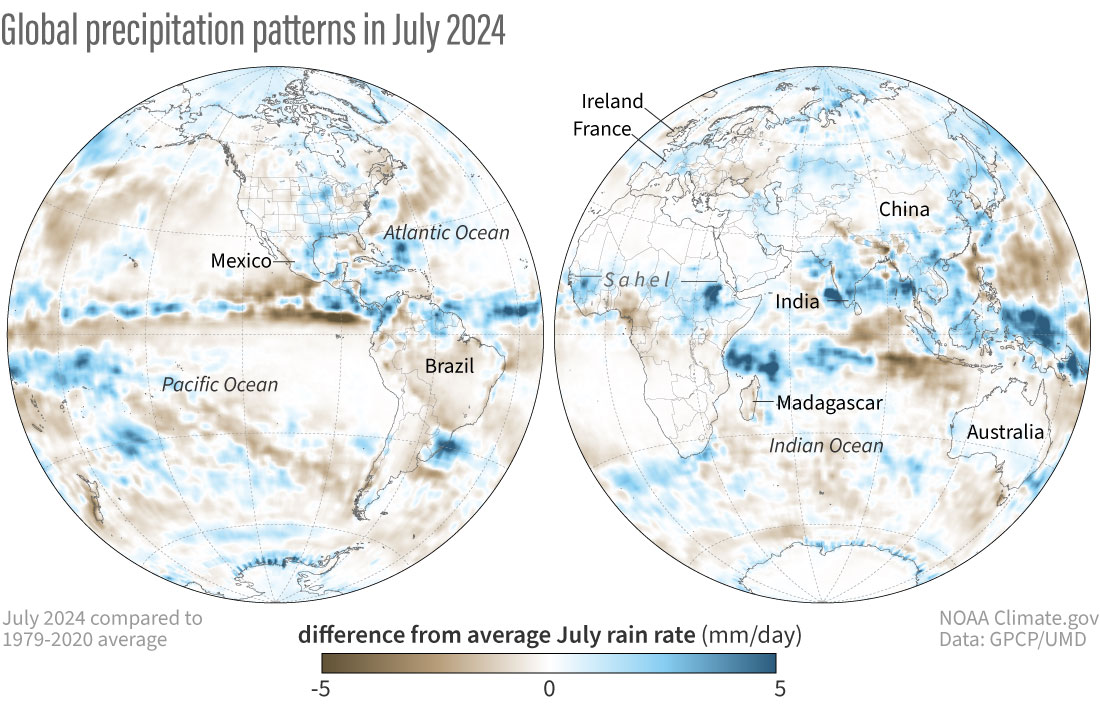
Difference from average precipitation around the world in July 2024 compared to the 1979-2020 average. Places that received more precipitation than average are colored blue; places that received less precipitation than average are colored brown. Map by NOAA Climate.gov, based on data provided by the Global Precipitation Climatology Project (University of Maryland).
This July we were in neutral ENSO conditions based on central Pacific Ocean SSTs [sea surface temperatures]. The precipitation anomaly [difference from the long-term average] pattern showed a strong South Asian Monsoon with heavy rain over the Indian and Indochina peninsulas, across the Philippines and into the western Pacific. The general positive anomaly over this large area might be thought of as consistent with a La Nina-type pattern, however a look at the ENSO composites for July, show it to be actually a little more like the El Nino composite [a map made by layering multiple maps of the same phenomenon over a span of time, such as precipitation for every July when there was an El Niño event] pattern. The pattern correlation numbers between this July’s anomaly pattern and the ENSO composites have the correlations remaining near zero, indicating the lack of overall ENSO effect on precipitation patterns this month.
With the ENSO effect being very subdued, are the remaining anomaly patterns for this July due to something else or just random? Comparing this July’s anomaly pattern with the trend pattern, one can discern some similarities. In fact, the spatial correlation between the two fields is not very big, but much bigger than the near zero ENSO effects this month. In other words, the effect of global warming is showing up (to some extent) in the July anomaly field, when it is not masked by ENSO effects.
The very active South Asian monsoon provided a wealth of rainfall to the Asian region, with associated occurrences of floods and landslides. This included the effects of an early season tropical cyclone, Typhoon Gaemi, which flooded parts of the Philippine islands, before tracking over Taiwan and into China and then affecting North Korea late in the month. Taiwan had a peak rainfall of over 1000 mm. Over 100 deaths were recorded due to the storm. Even before Gaemi, northeastern China had a bout of flooding early in the month. India also had above average July rainfall, with the state of Kerala along the southwest coast suffering landslides and floods with over 100 dead.
Africa also shows an active band of rainfall with an above-normal east-west feature across the continent centered at about 15°N. At the east end of that feature, landslides killed over 200 in Ethiopia.
The Atlantic hurricane season is just beginning and early in the month the second named storm, Beryl, hit Jamaica, crossed the Yucatan Peninsula into the Gulf of Mexico and hit Texas causing significant flooding in Houston and knocking out power there for over a week. And its remnants even caused flooding in Vermont a couple of days later. On the monthly scale Beryl helped to provide the positive rainfall anomaly across the southeast U.S., although the Mid-Atlantic states (e.g., Maryland) were tending toward drought this month. In the western U.S. conditions were dry, with below normal rainfall, and there were a number of wildfires, e.g., in Oregon, California and Colorado, and also in western Canada. Drought conditions extended into eastern Canada.
Over western Europe moderate conditions prevailed, but with negative rain anomalies extending from southeastern Europe northeastward above the Black Sea into northern Eurasia. South America was covered almost completely by negative anomalies.