Worldwide, many areas record warm in May 2015
Details
Compared to the 20th-century average, how much warmer or cooler will Earth’s temperature be in May 2015? That’s the question posed to readers and experts last month in our online Climate Challenge. Earlier this month, NOAA’s National Centers for Environmental Information reported that the May 2015 combined global average temperature over land and ocean surfaces was 0.87°C (1.57°F) warmer than average. May 2015 actually set a record, being the warmest May since recordkeeping began 136 years ago.
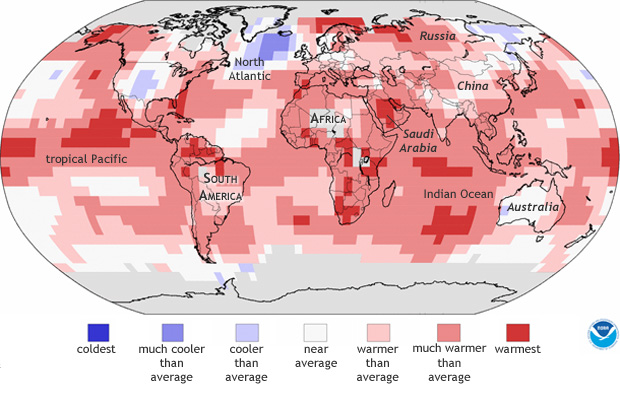
Reproduced from the NOAA Global Analysis, this map shows how global surface temperatures ranked compared to the 20th-century average. Cooler-than-average areas appear in shades of blue, and warmer-than-average areas appear in shades of pink and red. Near-average conditions are white.
Nowhere were temperatures the coldest on record, although cooler-than-average conditions did prevail over parts of the North Atlantic Ocean, North America, and eastern Russia. In contrast, record warmth occurred in multiple locations, including the eastern tropical Pacific, northern South America, Africa south of the Sahara Desert, and the Indian Ocean. Unusually warm temperatures predominated over most of the globe.
The experts’ average guess was very close to the observed temperature anomaly; on average the experts guessed 0.84°C (1.51°F) above the 20th-century average. The participants on average guessed 1.49°C (2.68°F) above average. Experts for this climate challenge included Jessica Blunden (ERT/Center for Weather and Climate), Nir Y. Krakauer (City College of New York), and David Herring (NOAA’s Climate Program Office).
The experts cited El Niño conditions emerging in the eastern tropical Pacific Ocean by early May 2015. Blunden explains, “Generally, El Niño conditions tend to enhance the overall global temperature with stronger events, such as those in 1997-1998 and 2009-2010, associated with higher temperatures.”
Of the experts, Krakauer came closest to the observed value*, with a guess of 0.86°C (1.55°F). To formulate his estimate, he turned to the National Centers for Environmental Information monthly temperature series through March 2015, pointing out two papers providing background information on temperature estimates: Estimating climate trends: Application to United States plant hardiness zones and Up-to-date probabilistic temperature climatologies.
Although global average temperature set a new record in May 2015, it toppled a record that was only a year old. May 2014 had been the warmest May on record, but the latest figure exceeded that measurement by 0.08°C (0.14°F) in NOAA’s analysis.
For more information on the effects of El Niño on global temperatures, see the blog post How will El Niño affect 2015’s placement among the warmest years on record?
*Regardless of our game, science must go on! Shortly after the closing of the May game round, NCEI released an update to the global surface temperature data product. In the updated version, recent monthly anomalies are slightly warmer than they were in the version of the dataset available during the game. While the update might have thrown the game players a bit of a curveball, biasing guesses a bit low, it would have affected both experts and participants equally. So, the playing field was level, and the May game results stand.
