Where will this week’s Northeast snowstorm fit into the historic record?
Details
UPDATE: Feb.4, 2015. Data are in for last week's storm—a Category 3 event according to the National Climatic Data Center. Images for the recent storm are available via links below the image at right.
A major winter storm was still blustering its way through the U.S. Northeast this morning, with continued snow accumulations and high winds predicted for many areas. How will this event compare to the region’s most historic storms?
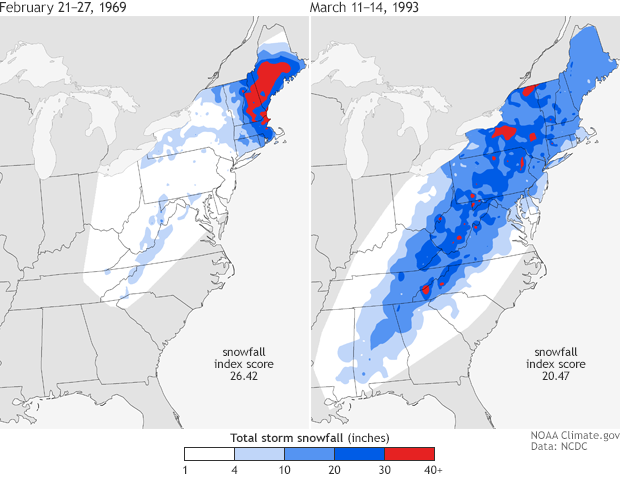
This image shows the snowfall accumulations during two of the most severe snowstorms in the Northeast in the past 115 years: the late February nor’easter of 1969 (left) and the mid-March “Storm of the Century” in 1993 (right). Snow accumulations range from 1-4 inches (white) to 30 or more inches (red). Based on NOAA’s “Regional Snowfall Index,” both events were Category 5 storms.
(Were you there? Share your memories with us on Facebook or twitter).
Most of us who live in places where it snows have a personal ranking for the worst snowstorms in our lifetime. Naturally, we base our rankings on how much impact the event had on things that mattered to us—how hard it was to get out of our driveway, how long we lost power at our house, how many days we missed school.
But the experts at NOAA’s National Climate Data Center—the nation’s official weather and climate record keepers—need an objective way to rank the severity of storms. The Regional Snowfall Index is a formula that takes into consideration the total area affected by snowfall of different depths, the number of people who live in those areas, and how common a given amount of snow is for a particular location.
Each storm is given an RSI score and a category ranging from Extreme (Category 5, most severe) to Notable (Category 1, least severe). Both the 1969 and 1993 storms were Category 5 snowstorms, with RSI scores of 26.42 and 20.465, respectively.
The 1969 snowstorm ranks as the Northeast’s most severe storm because the area that received 30 or more inches of snow was exceptionally large—5 times larger in 1969 than in 1993. Further, the population in the area with 30 or more inches was 3 times as large as during the 1993 event.
Despite its lower score on the regional snowfall index, the 1993 event is sometimes described as the “Storm of the Century,” in part because it affected such a large area of the country, including many places where significant snowfall is rare. In addition to snow, the system also produced severe thunderstorms, tornados, near-hurricane-force winds, large waves, and beach-battering storm surges up and down the East Coast.
When the snow from this storm wraps up, data from Northeast weather monitoring stations will start flowing into the National Climatic Data Center. Scientists there will calculate the storm’s score and give the event its place in the historic record. In the meantime, stay informed about what’s to come this winter by viewing weekly to seasonal climate outlooks from NOAA’s Climate Prediction Center and visiting your local National Weather Service website for the most up-to-date watches and warnings.
Caption by Rebecca Lindsey. Maps by NOAA Climate.gov, based on data from the National Climatic Center.
Links
View all historic storms @ http://www.ncdc.noaa.gov/snow-and-ice/rsi/overview
Details on the 1993 “Storm of the Century” @ http://www.erh.noaa.gov/ilm/archive/Superstorm93/
Details on the 1969 February Nor’easter @ http://en.wikipedia.org/wiki/February_1969_nor%27easter
