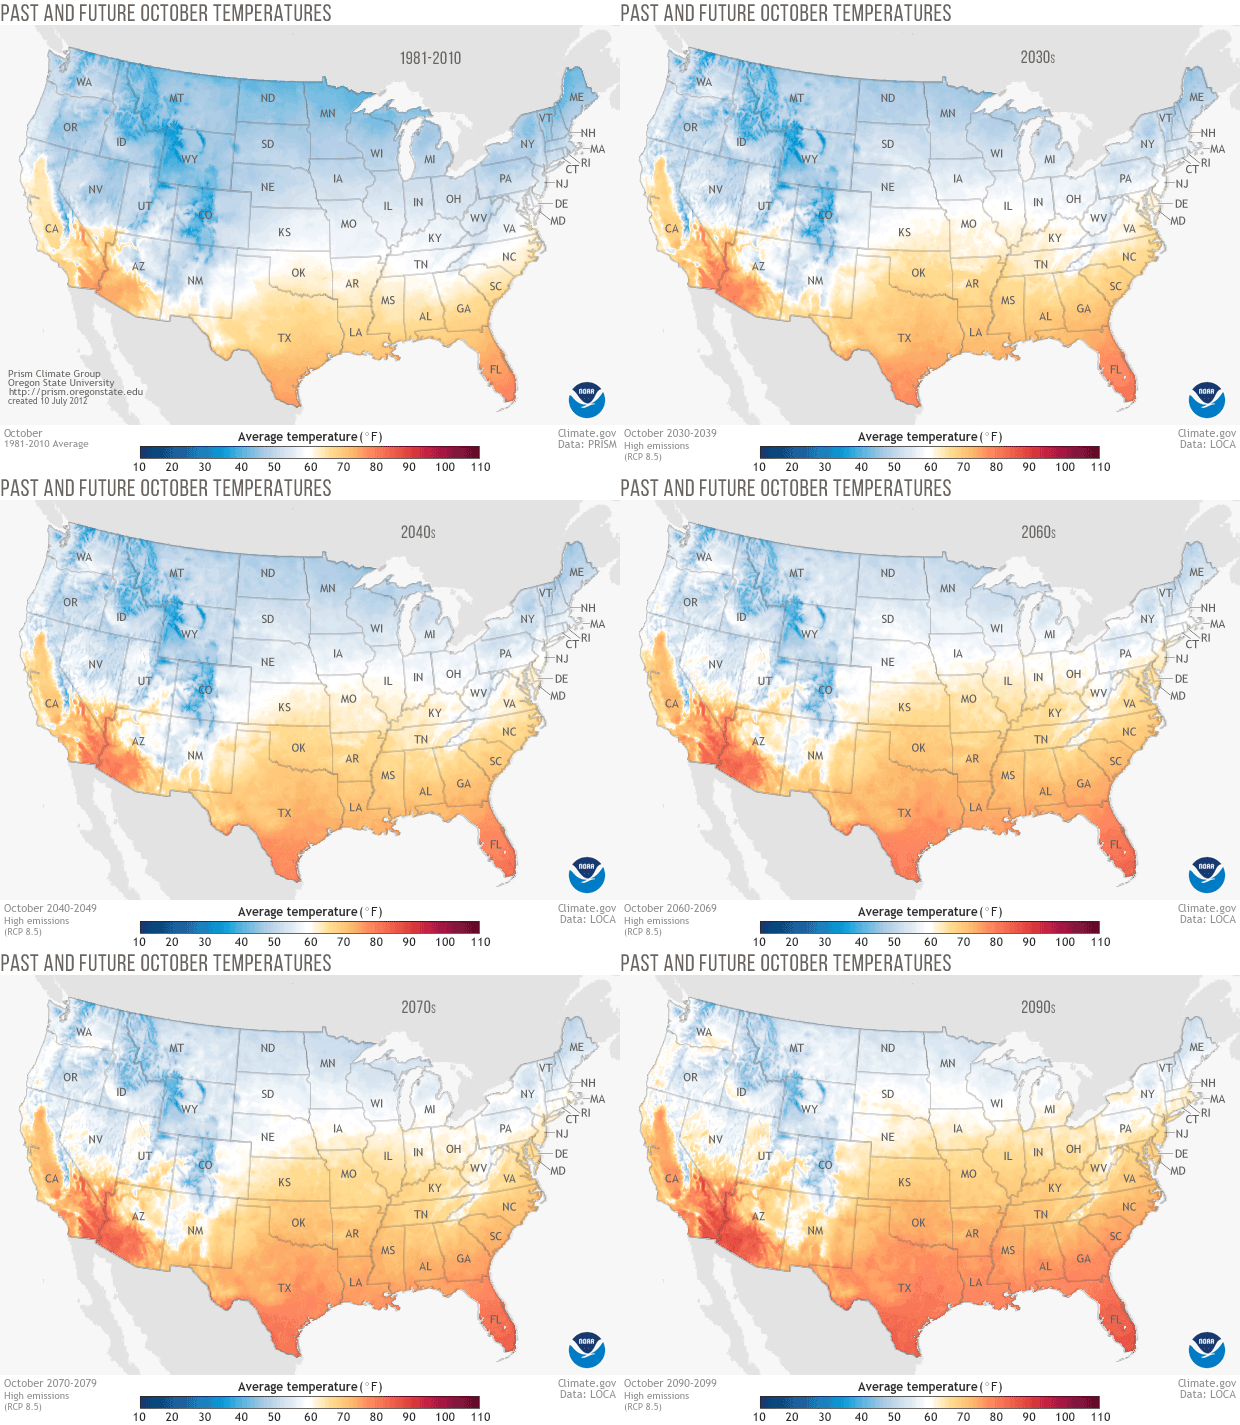
What will average U.S. temperatures look like in future Octobers?
Details
In order to meet future needs for energy, food, and public health, planners and other decision makers need to understand how temperatures are projected to change over the coming decades. As the climate system continues responding to the heat-trapping gases we have added to the atmosphere, temperatures will change at different rates in different regions. Images of projected future climate can help people get a sense of how much warming their region will experience each decade so they can plan ahead for new conditions.
This animated gif shows how October average temperatures in the contiguous United States are projected to change in coming decades if global carbon dioxide emissions continue along a high-emissions pathway (known in the climate research community as RCP 8.5). Colors show projected average daily temperature for each month from the 2020s through the 2090s, with blue colors for average monthly temperatures below 60° Fahrenheit, and yellow, orange, and red colors for temperatures warmer than 60°F.
The animation starts with an image of the recent past, based on October average temperature from 1981 to 2010 (PRISM normals). Over the period, most of the Lower 48 experienced average October temperatures near or below 60°F. Under a continued high-emission scenario, that national pattern flips. By the 2090s, the majority of the contiguous United States will experience average October temperatures above 60°F. To learn about the U.S. impacts of observed and future climate change, read the National Climate Assessment.
This animation was based on maps available in our Data Snapshots collection, which includes national maps of projected changes in monthly maximum (daytime high) and minimum (overnight low) temperatures for each month of the year. The collection includes larger versions of these maps, as well as projected temperatures under a lower-emissions pathway.
About the data
Temperature projections in these images represent output from 32 global climate models that are all part of the Coupled Model Intercomparison Project Phase 5 (CMIP5). To produce regionally relevant projections, results from the global models were statistically downscaled using a method called Localized Constructed Analogs (LOCA). This technique uses observed local-scale weather and climate information to increase the spatial resolution of global-scale projections, and corrects for bias in the model simulations. For further information about how the images were made, see the About this Snapshot page in Data Snapshots. To see more maps, visit the Projections tab of Data Snapshots.
