U.S. temperature and precipitation near average in April 2020
Details
April 2020 temperature was near average for the contiguous United States as whole, with areas that were cooler than the long-term average roughly balanced by areas that were warmer than average according to the latest U.S. monthly climate summary from NOAA National Centers for Environmental Information.
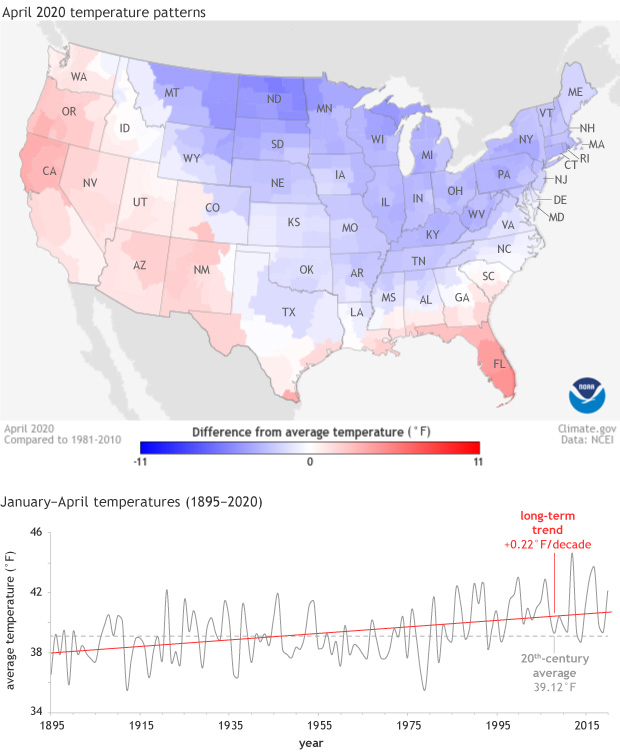
This map shows where temperatures in April 2020 were above (red) or below (blue) the 1981-2010 average. (The maps use the 1981-2010 average so that current conditions can be compared to the recent past). Along the country’s western and southern perimeters, April average temperatures were slightly warmer than average. This band of warmth enclosed a broad area of temperatures from the Great Plains to the Northeast that were colder than average. According to NCEI, these patterns balanced out into a national average temperature of 50.9° Fahrenheit, which was 0.2°F below the twentieth-century average.
Meanwhile, year to date temperature (January-April) was 42.2°F, which is 3°F warmer than average, making the first third of 2020 the 10th-warmest such period on record. The graph shows average temperature for each January-April period from 1895-2020 (gray line), the twentieth-century average (dashed line), and the long-term warming trend (red line), which is 0.22°F per decade over the historical record. National temperatures range from the mid-30s to the mid-40s over the historical record. Starting in the early 1980s, however, temperature in the first part of the year has rarely been below average, evidence of the long-term warming trend.
Map by NOAA Climate.gov, based on climate division data from NCEI. Graph based on data from NCEI’s Climate at a Glance tool. For more maps of monthly climate conditions, visit our Data Snapshots collection. For more details on the April 2020 climate, including preliminary information on the tragic tornado outbreak, read the NCEI summary.
