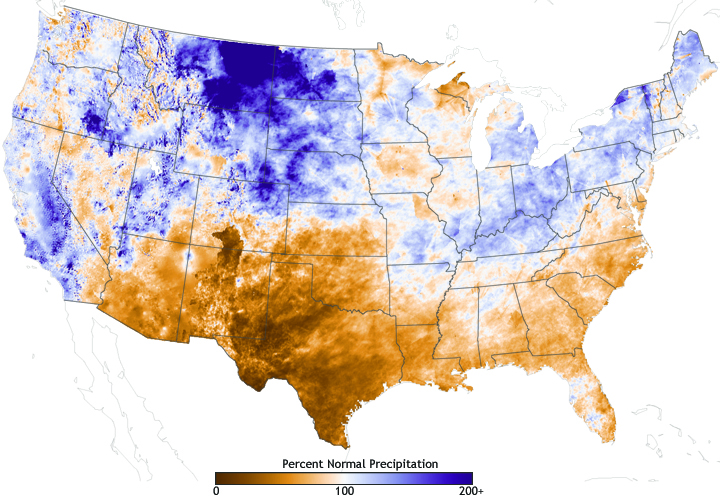
Texas & Southwest See Fraction of Normal Rainfall
Details
In summer 2011, the South was in the grip of severe, and in some cases exceptional, drought. The map above shows the difference from normal precipitation received in the United States between October 1, 2010 (the beginning of the West’s water year) and August 21, 2011.
Areas with less-than-normal precipitation are shades of orange and brown, areas with near-normal rainfall are white, and areas where precipitation was above normal are blue. Many parts of New Mexico and western Texas have received less than 25 percent of normal rainfall—in some places, far less—over this 10-month span.
For more on climate conditions in summer 2011, see Drought in the Southern United States.
Map by Hunter Allen, based on precipitation data from the NOAA/NWS Advanced Hydrologic Prediction Service.
