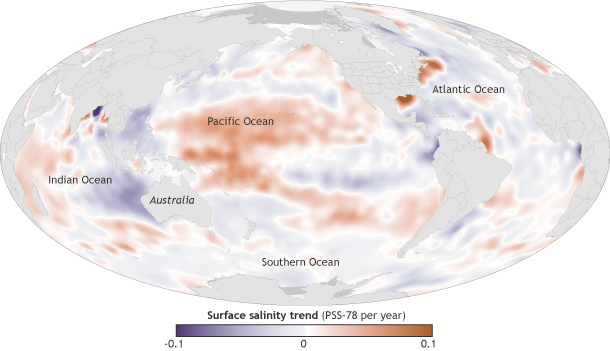
Shifting ocean surface saltiness from 2004-2013
Details
All seawater is salty, but did you know that saltiness varies from one region to another across the world’s oceans? Not only that, but changes in evaporation and rainfall, ocean currents, melting ice, and freshwater influx from rivers or streams can influence patterns of sea surface salinity, making some regions saltier and other regions fresher over time.
This map shows change in surface salinity from 2004-2013, based on measurements from a fleet of free-drifting, robotic sensors that have been collecting temperature and salinity observations across the oceans since 2004. Relative saltiness is described with the Practical Salinity Scale, which was developed by ocean scientists in the late 1970s. (Like the Richter scale for earthquakes, the Practical Salinity Scale has no units.) Positive numbers show places that became saltier (orange), while negative numbers show places that became fresher (purple).
Across the globe, changes in surface salinity over time generally match changes in precipitation: places where rainfall declines become saltier, while places where rainfall increases become fresher. On a decadal time span, trends can be influenced by periods of strong year-to-year climate variability. The patterns on the map are likely a result of both trends and natural variability.
For example, freshening trends west of Australia may be influenced by huge amounts of rain that fell over Australia and surrounding areas during La Niña events that occurred during 2010–2012, and therefore the freshening trend may disappear with a few more years of data. On the other hand, big increases in freshness in the Bay of Bengal are consistent with an observed decades-long increase in precipitation in the region.
One reason scientists are so interested in changes in ocean surface salinity is that studies incorporating both observations and climate model simulations indicate that over time, global warming will intensify the water cycle: rainy areas will become even wetter and dry areas will become even drier. Global precipitation patterns suggest this intensification may already be taking place.
These changes should make fresh areas of the ocean fresher and salty areas even saltier. Some of the patterns on the map are consistent with an intensification of the hydrological cycle. Parts of the Southern Ocean and the northern North Atlantic—both of which are already relatively fresh—got fresher between 2004-2013. The Mediterranean Sea and parts of the subtropics of the Pacific and the Atlantic in both hemispheres—already among the saltiest seas—became saltier. Scientists will keep a close eye on salinity patterns as years go by to see if these short-term trends become solid evidence of long-term change.
In addition to understanding the ocean’s role in Earth's water cycles, scientists are also tracking both surface and sub-surface salinity to better understand ocean circulation, which is driven by density differences created by temperature and salinity. Melting ice sheets could cause changes in ocean salinity that could potentially to alter circulation patterns, influencing weather in parts of the world.
Map by NOAA Climate.gov, based on Argo data provided by John Lyman. Adapted from Figure 3.12(a) in State of the Climate in 2013.
References
G. C. Johnson, J. M. Lyman, G. S. E. Lagerloef, and H.Y. Kao, 2014: [Ocean temperature and salinity] Sea Surface Salinity [in “State of the Climate in 2013”]. Bulletin of the American Meteorological Society (BAMS), S60-S62.
Held, I. M., and B. J. Soden, 2006: Robust response of the hydrological cycle to global warming. J. Climate, 19, 5686–5699.
Zhou, Y. P., K.‐M. Xu, Y. C. Sud, and A. K. Betts (2011), Recent trends of the tropical hydrological cycle inferred from Global Precipitation Climatology Project and International Satellite Cloud Climatology Project data, J. Geophys. Res., 116, D09101, doi:10.1029/2010JD015197.
