Research cruises reveal global warming reaching the deep Southern Ocean
Details
Since the 1980s, teams of scientists have sailed on repeat cruises around the global ocean, following the same routes each decade and collecting observations of temperature, salinity, and other water properties along the way. Among many important findings, these cruises have revealed where and how quickly the excess heat from human-caused global warming has spread through the deep ocean.
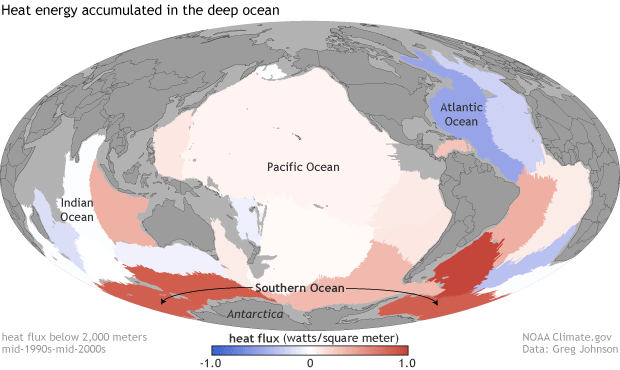
This map shows the long-term heat storage trends at ocean depths between 2,000–6,000 meters (1.2–3.7 miles) from the early 1990s through the mid 2000s. It’s based on an analysis of ship cruise data by a former graduate student at the University of Washington and her advisor, an oceanographer from NOAA’s Pacific Marine Ecological Laboratory. The rate of heat gain in red areas was up to 1 watt per square meter. (A watt is one joule of energy every second). Blue areas had heat losses of up to 1 watt per square meter. Gray areas do not have enough repeat observations to estimate trends.
Of all observed locations, the biggest rates of warming are in the Southern Ocean. That area is the birthplace of the planet’s coldest ocean waters, the “Antarctic Bottom Waters,” which are formed when salty, wind-chilled water around Antarctica sinks to the seafloor and spreads northward. The fact that these deep waters have warmed significantly suggests that human-caused climate change has reached one of the most remote corners of the ocean’s “circulatory system.”
In an updated analysis of the deep ocean heat budget, scientists recently estimated that between 1991–2010, the net global rate of heat gain below 2,000 meters was about 33 trillion watts (plus or minus 20 trillion), which is about 10% of the energy imbalance created by human-caused global warming over the last decade.
Deep ocean temperature observations come from a device called a “CTD” profiler. As ships cruise along transects from coast to coast, they make pre-determined stops every 55 kilometers (30 nautical miles) or so, and the CTDs are lowered to just above the ocean floor on miles-long cables. The devices record observations continuously, and also collect water samples at carefully selected depths before they are hauled back up on deck and readied for the next drop.
Repeat research cruises to obtain these kinds of measurements are difficult to plan and execute, labor intensive, and expensive—and that’s before you factor in the possibility of pirates. But they are also critical for understanding change in the deep ocean. While satellites can observe the surface, and a global fleet of aquatic robots has been cruising the upper 2,000 meters of the global ocean since around 2000, repeat ship cruises along established routes are the only source (for now) of long-running, global-scale observations of the deep ocean.
References
Desbruyères, D. G., S. G. Purkey, E. L. McDonagh, G. C. Johnson, and B. A. King (2016). Deep and abyssal ocean warming from 35 years of repeat hydrography. Geophysical Research Letters, 43 (10), 356–365. https://doi.org/10.1002/2016GL070413.
Johnson, G. C., J. M. Lyman, and N. G. Loeb (2016). Improving estimates of Earth's energy imbalance. Nature Climate Change, 6, 639–640. https://doi.org/10.1038/nclimate3043.
Purkey, S. G., and G. C. Johnson (2010). Warming of global abyssal and deep Southern Ocean waters between the 1990s and 2000s: Contributions to global heat and sea level rise budgets. Journal of Climate, 23, 6336–6351, https://doi.org/10.1175/2010JCLI3682.1.
