October 2012 Global Temperature Update
Details
According to the latest monthly analysis from the National Climatic Data Center, the average global temperature for October 2012 was the fifth warmest October since recordkeeping began in 1880. It also marked the 36th consecutive October and 332nd consecutive month with a global temperature above the 20th-century average. The last below-average October temperature was October 1976.
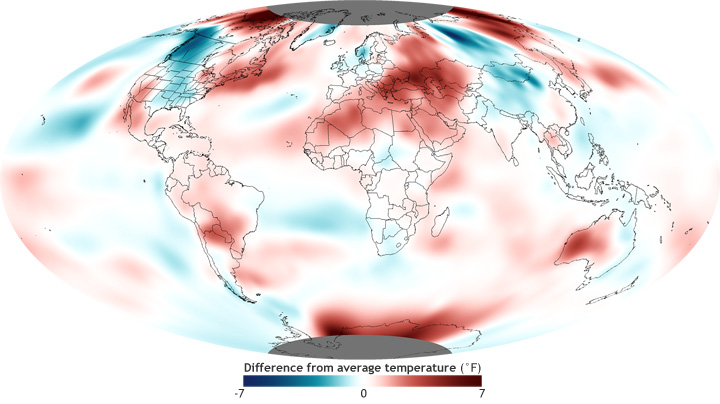
The map at right shows October temperatures relative to average across the globe. Red indicates temperatures up to 7° Fahrenheit (4° Celsius) warmer than the 1981–2010 average, and blue indicates temperatures up to 7° Fahrenheit cooler than the average. As indicated by the red areas on the map, much of Europe, western and far eastern Asia, northeastern and southwestern North America, central South America, northern Africa, and most of Australia all saw higher-than-average October temperatures. Meanwhile, much of northwestern and central North America, central Asia, parts of western and northern Europe, and southern Africa all saw below average October temperatures.
The average global land surface temperature was the eighth warmest for October, with temperatures nearly 1.7° Fahrenheit above the 20th-century average. The average global sea surface temperature tied 2004 as the fourth highest for October at almost 1° Fahrenheit above the 20th-century average. The northwestern Atlantic Ocean and part of the north central Pacific Ocean temperatures were considerably higher than average, while much of the eastern and part of the western Pacific Ocean and much of the southern Atlantic Ocean were below average.
Some of the largest differences from average temperature are located around the Arctic. Overall, 2012 has been a dramatic year for Arctic sea ice. After reaching its record smallest minimum extent in September, Arctic sea ice doubled in size during October, the first full month of the annual growth cycle. October Arctic sea ice extent was 2.7 million square miles, which is 24.6 percent below average. This marked the second smallest monthly sea ice extent on record, slightly larger than the record small October extent of 2007.
Map by Dan Pisut, NOAA Environmental Visualization Lab. Caption by Jessica Blunden and Susan Osborne. Adapted from the October 2012 Global Climate Report from NOAA’s National Climatic Data Center (NCDC). Reviewed by Jessica Blunden, NCDC
