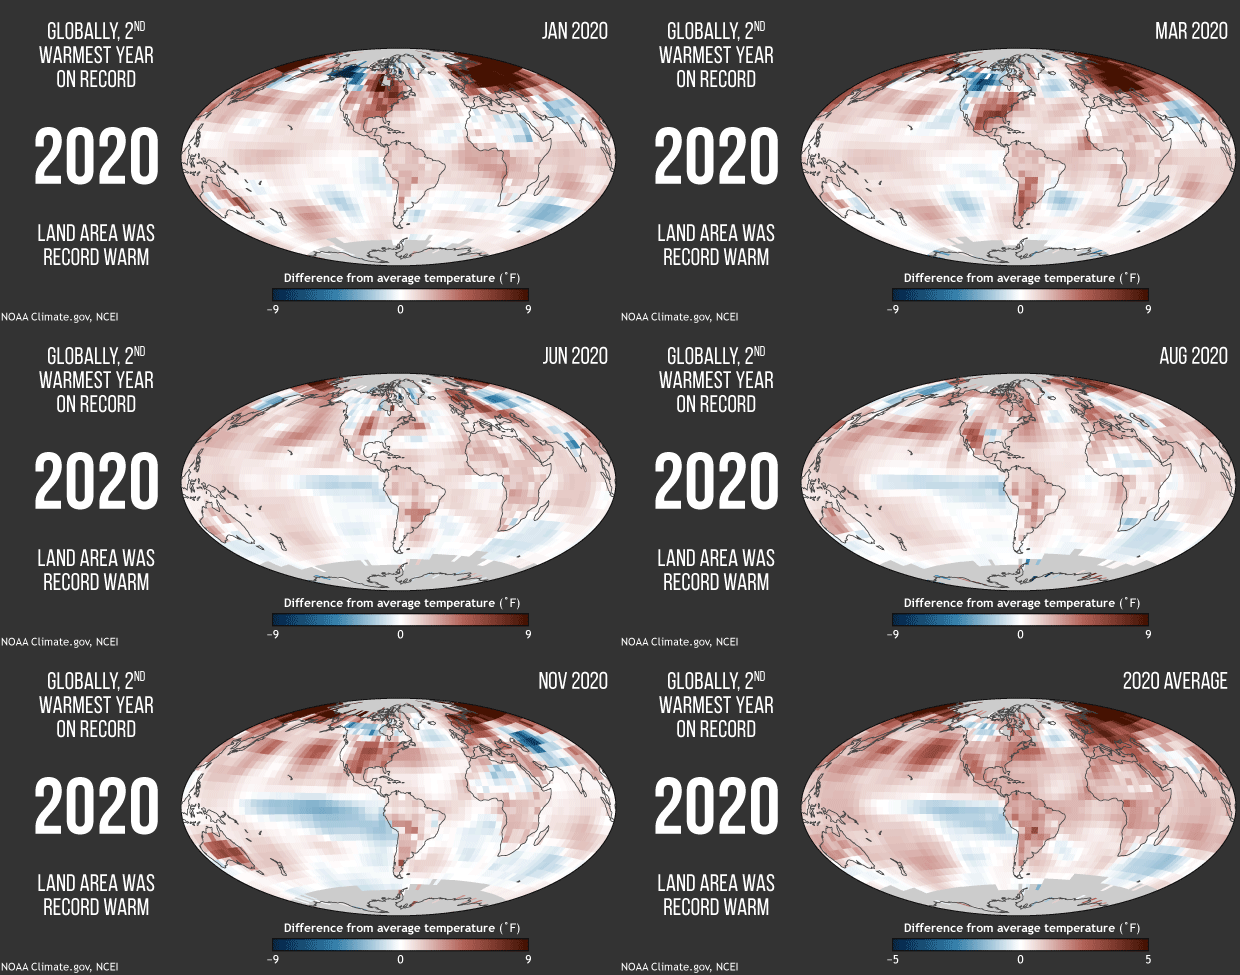
Month-by-month recap of 2020's global temperature patterns
Details
Averaged across land and ocean, the 2020 surface temperature was 1.76° F (0.98° Celsius) warmer than the twentieth-century average and 2.14˚F (1.19˚C) warmer than the pre-industrial period (1880-1900). According to the 2020 climate highlights released today by the National Centers for Environmental Information (NCEI), this makes 2020 the second-warmest year in NOAAs temperature record, which extends back to 1880.
This animation shows maps of monthly temperatures for January–December 2020 compared to the 1981–2010 average, with areas that were warmer than average in red and areas that were cooler than average in blue. The final frame of the animation shows the overall average for the year. Note that the temperature range on the monthly maps is broader than the range for the annual average (plus or minus 9 degrees versus plus or minus 5 degrees).
The big temperature story of the first half of the year was the extreme warmth over Europe and Russia. The extreme heat began losing its grip over Europe in late spring, but persisted in Russia, through May. Despite a moderately strong La Niña event that cooled a wide swath of the tropical Pacific Ocean in the second half of the year, 2020 came just 0.04˚ Fahrenheit (0.02˚Celsius) shy of tying 2016 for warmest year on record. Average temperature over land areas was record warm.
The full list of 2020 global climate highlights are available from NCEI.
