June 2013 U.S. Climate Update
Details
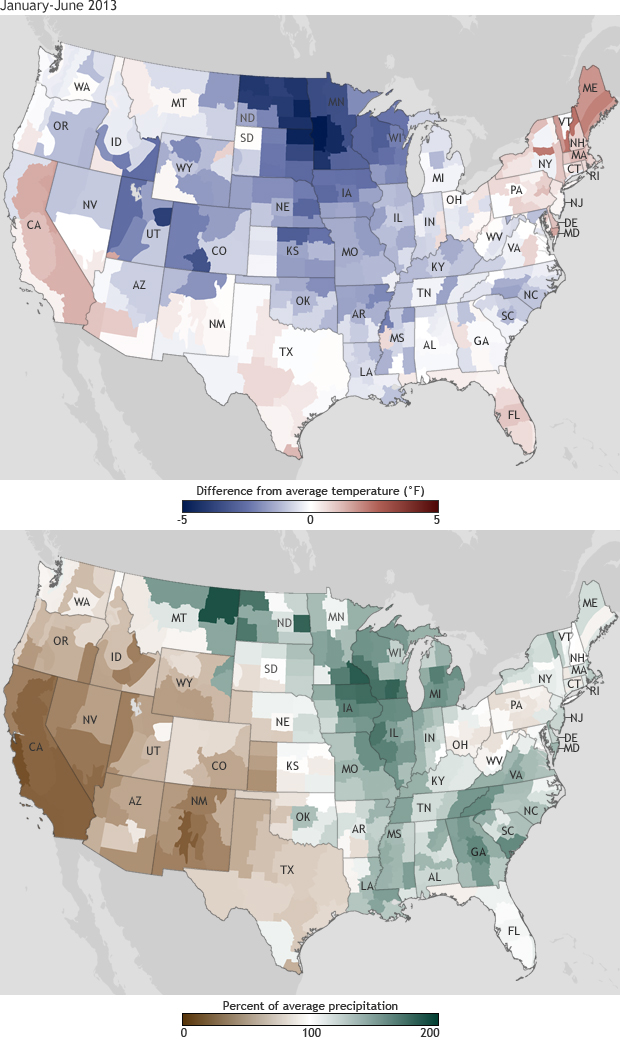
For the first six months of 2013, the contiguous United States has been nearly split in half by temperature and precipitation differences. Much of the East has been dealing with below- or near-normal temperatures, above-normal precipitation, and flooding while much of the West has been dealing with above-normal temperatures, below-normal precipitation, and drought.
As a whole, though, the country has seen above-average temperatures and above-average precipitation for the first six months of the year. According to the latest statistics from the National Climatic Data Center, the January–June national average temperature of 48.1° Fahrenheit was half a degree above the 20th-century average. And the overall January–June precipitation total of 15.71 inches was nearly an inch above average.
The maps above show temperatures (top) and the percent of average precipitation (bottom) for January–June 2013 compared to the 1981–2010 averages across the United States. On the temperature map, shades of red indicate temperatures up to 8° Fahrenheit warmer and shades of blue indicate temperatures up to 8° Fahrenheit cooler than average. On the precipitation map, brown areas received less than and green areas received more than 100% of their average precipitation.
As the red-shaded regions on the temperature map indicate, parts of the West saw above-average temperatures for the first half of the year. California had its 11th warmest six-month period on record. On the other hand, temperatures throughout the Mississippi River Valley—from Minnesota all the way down to Mississippi—were cooler than the average from the past three decades. (Still, the country as a whole was warmer than the past century's average.)
Temperatures weren’t the only thing vastly different for the two halves of the nation between January and June. Below-normal precipitation and drought continued to remain entrenched throughout much of the West and into the Central and Southern Plains. Oregon, Nevada, Idaho, and New Mexico each had January–June precipitation totals ranking among their 10 lowest. California had its driest first six months of the year ever recorded at 9.80 inches below average, beating the previous record by over 1.5 inches.
The eastern half of the country was a totally different ball game, however, with 12 states having one of their 10 wettest year-to-date periods. Illinois, Iowa, Michigan, and Wisconsin each had January–June precipitation totals that were their wettest on record. By the end of June, all locations east of the Mississippi River were drought free for the first time since May 2005.
Caption by Susan Osborne and Jake Crouch adapted from the June 2013 National Climate Report from the National Climatic Data Center (NCDC). Maps by NOAA Climate.gov team, based on U.S. Climate Division data from NCDC. Reviewed by Jake Crouch, National Climatic Data Center.
