Jet Stream Brings Two Very Different Junes to the Western & Eastern U.S.
Details
They say the grass is always greener on the other side of the fence, and that was certainly true in June. Throughout the month, two very different stories played out in the contiguous United States. While the drought-stricken West fell into the grips of an intense heat wave, East Coasters were bombarded by summer thunderstorms. In this scenario, a well-known river of moisture in the upper atmosphere—the jet stream—served as the imaginary fence between the East’s lush landscapes and the West’s parched fields.
Was it wet or dry in your neck of the woods in June? Go to the bottom of this page to learn how you can submit your own photos to #climateoncamera social media project!
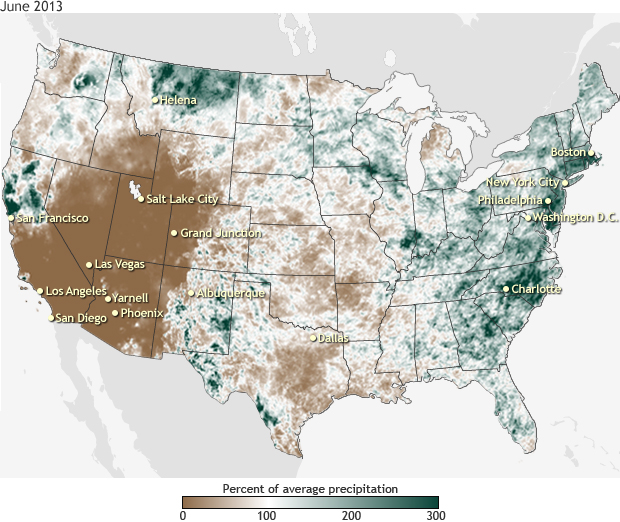
The map to the right shows the percent of normal precipitation for the month of June 2013. "Normal" in this case refers to the 1981-2010 average for June. Areas with less-than-normal precipitation are shades of orange and brown, areas with near-normal rainfall are white, and areas where precipitation was greater than normal are green. The color scale stops at 300 percent of normal, but some parts of the mid-Atlantic region—including Maryland, Delaware, New Jersey, and North Carolina—saw more than 400 percent of normal precipitation.
Meanwhile, the majority of Southern California, Arizona, Nevada, and Utah received less than 10 percent of normal rainfall—in some places, far less—throughout the month. An extreme heat wave worsened drought conditions in the Southwest, even in desert areas that do not normally receive much precipitation at this time of year.
As drought intensified and temperatures skyrocketed in the region, intense wildfires began to spark including Colorado’s most destructive fire in state history and the Yarnell Fire in Arizona that killed 19 firefighters. On the heels of a dry and volatile June, the National Interagency Fire Center reported 22 total active fires as of July 9.
During June, the jet stream developed kinks in its air current that served to shuttle moisture-packed frontal systems and their associated thunderstorms toward the East Coast while leaving the West high and dry. These kinks are called troughs and ridges. A ridge is a large area of above normal atmospheric pressure that pushes the jet stream northward of its usual position. A trough is a low-pressure area that allows the jet stream to dip southward. Since early June, the eastern half of the U.S. has been sandwiched between two ridges: one over the West and the other over the western Atlantic, creating a trough in between. (See a map of the upper level circulation here.)
“The western U.S. was under an upper level ridge during a good part of June,” explains David Unger, a meteorologist from the NOAA Climate Prediction Center. “This focused the jet stream over the northern Rocky Mountains where it brought unusually wet conditions to Montana and southern Alberta, and caused severe flooding in the city of Calgary. Beneath this ridge, the Southwest was left unusually hot and dry.”
“Meanwhile, a persistent upper level trough pulled the jet stream south of its normal position over the East. In early June, we saw the jet stream steer Tropical Storm Andrea northward, drenching the eastern seaboard. The upper level trough then persisted through much of the month, bringing wet conditions for most areas east of the Mississippi River.”
SOCIAL MEDIA PROJECT - SUBMIT YOUR PHOTOS!
Was it wet or dry in your neck of the woods during the month of June? Did you snap a photo of the scorched Earth as you soared above a wildfire on an airplane? Did your blooming backyard garden benefit from the summer rains? We want to see how precipitation extremes—drought, wildfires, floods, stunning storm clouds—changed landscapes across the country. Post your photos to our Facebook page with a short caption, or tag us! On Twitter, tweet us your photos @NOAAClimate using #climateoncamera and we'll retweet our favorites. By tweeting us or tagging us on any social media platform (Facebook, Twitter, or Instagram), you are making your photo submission eligible to be shared via our Facebook page.
*Remember, if you're using the hashtag or tagging us on Facebook but have a private profile, click on the little icon below your post and select 'Public' so we can see it!
Caption by Caitlyn Kennedy. Map by Hunter Allen, based on precipitation data from the NOAA/NWS Advanced Hydrologic Prediction Service. Reviewed by David Unger, NOAA Climate Prediction Center.
Resources:
The Jet Stream—NOAA Online School for Weather
Why is it so wet in Washington, D.C.? Washington Post Capital Weather Gang Blog. Posted July 2, 2013.
Situation Report. National Interagency Fire Center. Posted July 9, 2013.
