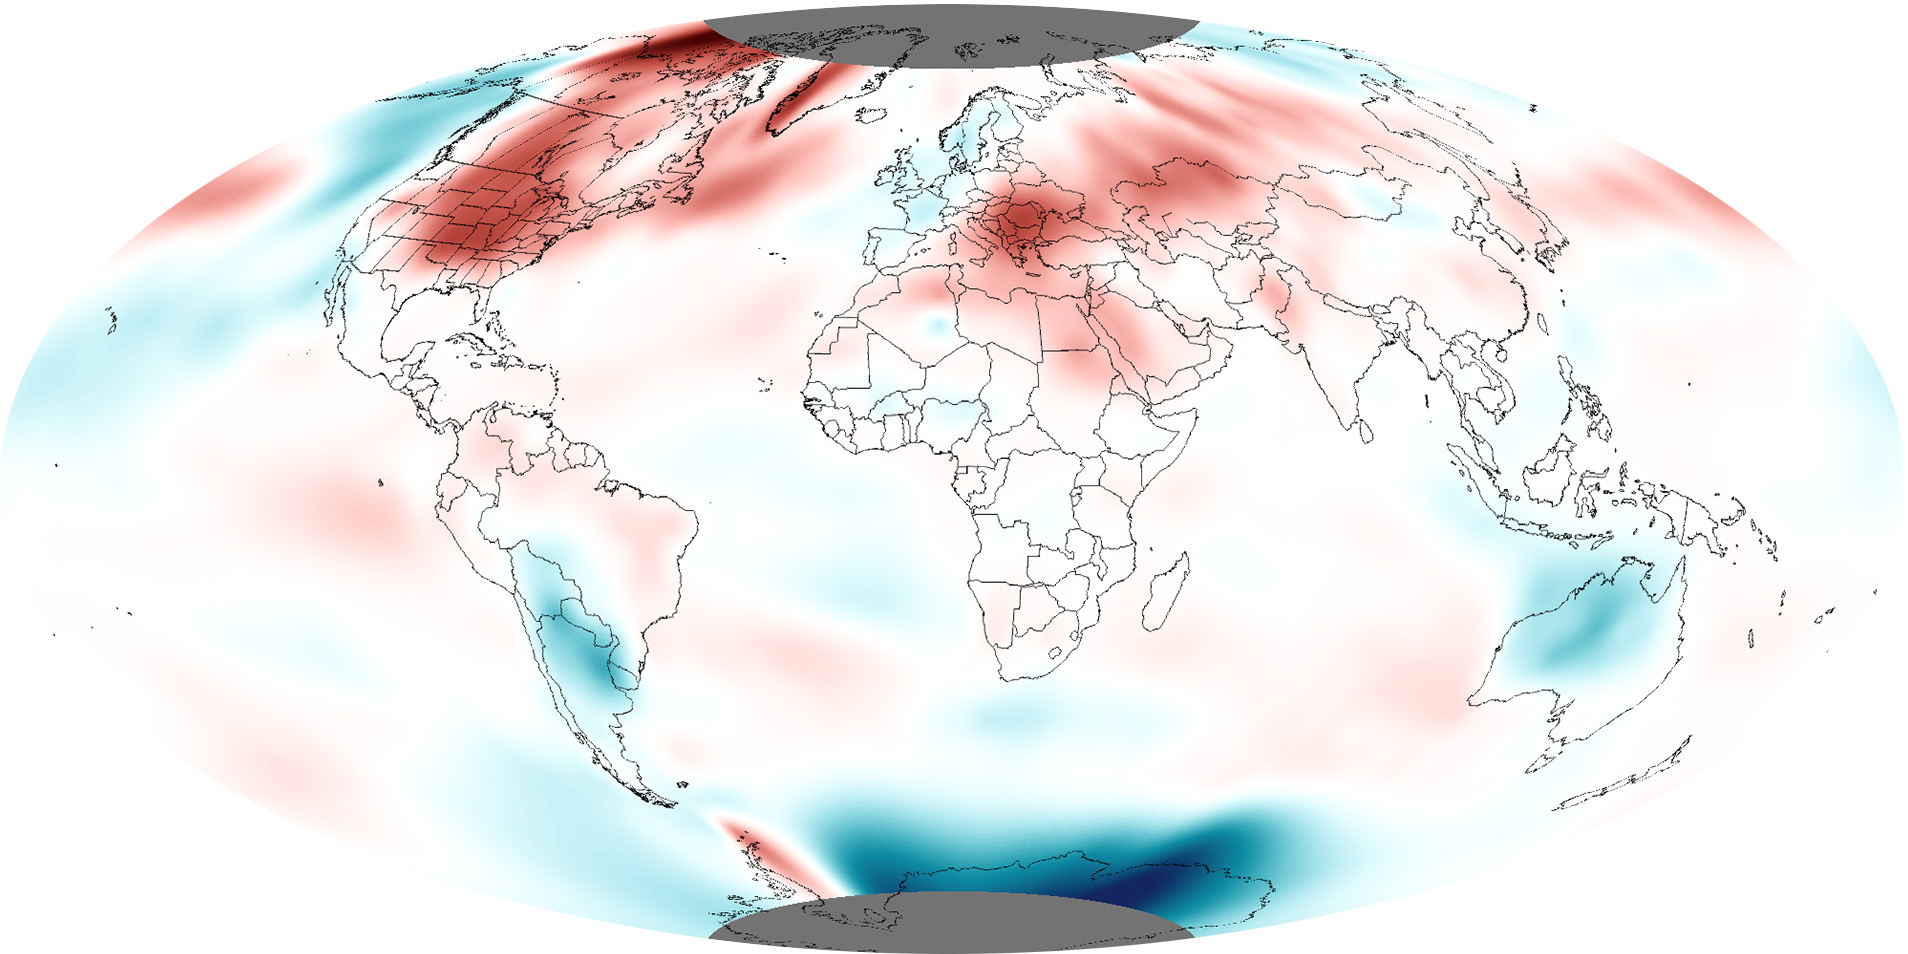
Hot and cold contrasts add up to planet's 4th warmest July on record
Details
The average global temperature for July 2012 was more than 1° Fahrenheit above the 20th-century average, making it the fourth warmest July since record keeping began in 1880. July 2012 also marks the 36th consecutive July and the 329th consecutive month with a global temperature above the 20th-century average. The last July with below-average temperature was July 1976, and the last month with below-average temperature was February 1985.
The map above shows July temperatures relative to average across the globe. Red indicates temperatures up to 11°Fahrenheit warmer than the 1981–2010 average, and blue indicates temperatures up to 11°Fahrenheit cooler than the average. Most areas of the world experienced higher-than-average monthly temperatures. The most unusually warm spots were the central U.S. and Canada, Greenland, and southeastern Europe. However, Australia, northern and western Europe, eastern Russia, Alaska, and southern South America were notably cooler than average.
Considering only land areas, global temperature tied with 2002 as the third warmest July on record, with temperatures more than 1.5°Fahrenheit above the 20th-century average. For the oceans, the July global sea surface temperature was close to 1°Fahrenheit above the 20th-century average, tying with 2006 as the seventh warmest July on record. This was also the highest monthly global ocean temperature departure from average for any month since July 2010.
The map reveals that temperatures in the eastern equatorial Pacific Ocean were slightly above average, but as of the end of July, the basin was still officially “neutral” with respect to the El Niño-Southern Oscillation climate pattern. However, according to NOAA’s Climate Prediction Center, El Niño conditions—the warm phase—will likely develop between now and September. In addition to influencing seasonal climate in the United States, El Niño is often, but not always, associated with global temperatures that are higher than normal.
Map based on temperature anomaly data from the National Climatic Data Center. Caption adapted by Susan Osborne from the NCDC’s July 2012 Global Climate Report.
Links
Global Climate Summary—July 2012
Climate Prediction Center’s El Niño-Southern Oscillation Page
