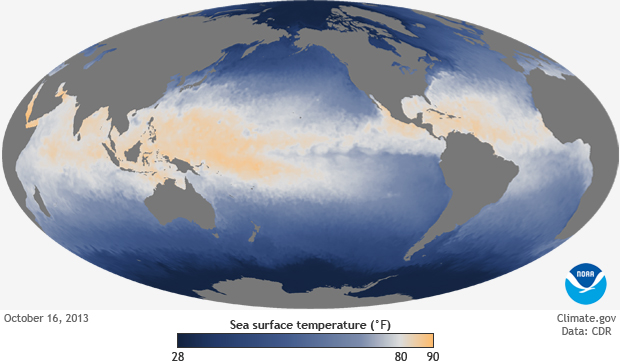
Data Snapshots: Sea Surface Temperature on October 16, 2013
Details
In brief
Colors on this map show the temperature of water at the ocean’s surface. While heat is stored and mixed throughout the depth of the ocean, it is the temperature at the surface—where the ocean is in direct contact with the atmosphere—that plays a significant role in weather and short-term climate.
The darkest blue areas on the map show sea surface temperatures as low as 28°F. Lighter shades of blue show warmer temperatures, up to 80°F. White and orange areas on the map show where the surface temperature is above 80°F, warm enough to fuel tropical cyclones or hurricanes that might develop.
More Information
Temperatures on the map come from a combination of satellite measurements, readings taken by ships and buoys, and maps of sea ice concentration. To produce the daily map, observations from all sources are merged on a grid. The operational NOAA product represented by the map is Daily 1/4° Optimum Interpolated Sea Surface Temperature. The National Climatic Data Center's Climate Data Records Program offers access to these and other climate data records as part of their effort to provide trustworthy information on how, where, and to what extent the land, oceans, atmosphere, and ice sheets are changing.
