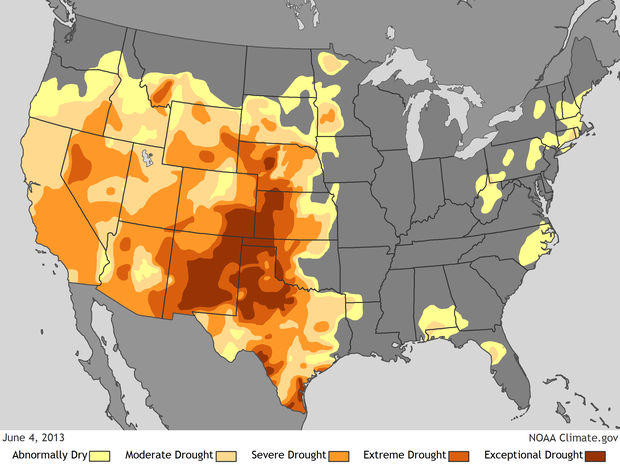
Climate Conditions: Drought Status on June 4, 2013
Details
In brief
This map shows drought status across the contiguous United States on June 4, 2013. Colors on the map indicate areas that are abnormally dry (yellow) or experiencing some level of drought (tan through dark red). For areas in drought, the darker the color, the more severe the drought. The weekly U.S. Drought Monitor reports approximately 44 percent of the contiguous United States was in some level of drought on this date. An additional 11 percent was classified as abnormally dry.
More Info
Drought is not just a long period without rain: an area is considered to be in drought whenever the environment has less moisture than usual for months or more at a time. To produce weekly drought maps, experts consider what’s normal and then consult recent observations of parameters such as rain, snow, temperature, soil moisture, and streamflow. They also consider reports of drought impacts such as decreased availability of water or stressed conditions for crops, livestock, and wildlife. A group of climatologists, extension agents, and other experts across the nation review each map before it is released to the public.
Map data from U.S. Drought Monitor. Caption adapted from DROUGHT: The Weekly Drill behind the U.S. Drought Monitor.
Additional Information
National Drought Mitigtion Center Drought Impact Reporter
Climate Prediction Center Seasonal Drought Outlook
National Climatic Data Center First of a series of brief articles on drought
