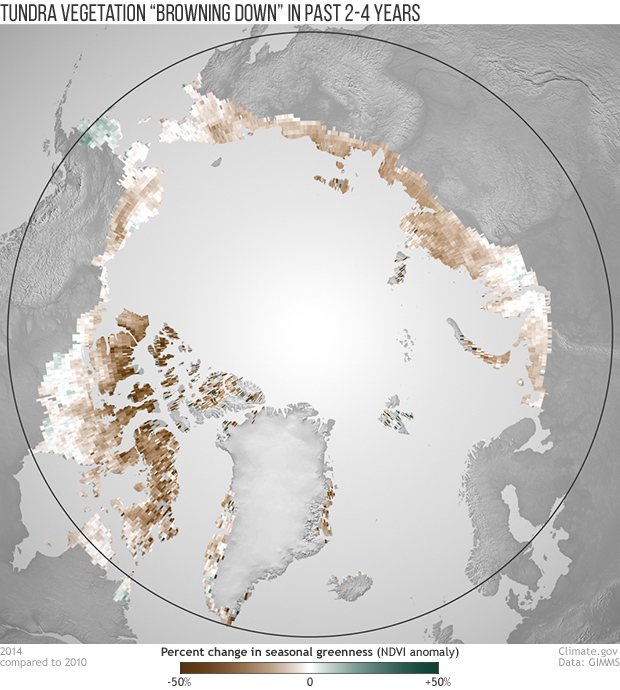
Arctic tundra “browning down” over past few years
Details
Plant-covered ground has a unique appearance from a satellite's point of view; it reflects a lot of near-infrared light, and it absorbs a lot of visible light, especially red. Scientists call this unique signature "greenness." As the Arctic has warmed over the past three decades, satellites reveal it has also grown greener overall. But in recent years, the tundra appears to be “browning down.”
The map shows overall changes in greenness over the Arctic growing season between 2010 and 2014, based on NASA/NOAA satellite observations. All around the Arctic, the tundra has become browner, with the greatest change occurring on the far northern Canadian Arctic Archipelago. Southwestern Alaska is the only area that saw a large area of increased vegetation greenness.
Greenness varies considerably from year to year, and it has increased over the full period of record since 1982. Since 2011, however, Arctic greenness has decreased 8.7 percent, according to the 2015 Arctic Report Card. Many different factors could be responsible for observed vegetation change: changes in open water in the summer, summer warmth, snow cover, or freeze-thaw events. Non-climate related factors, such as impacts from wildfires, drained lakes and industrial infrastructure, can also influence satellite greenness estimates.
Increased or decreased "greenness" is a general indication of more or less vegetation, but it doesn't pinpoint the exact change. Increased season-long greenness could mean, for example, that leafier shrubs or trees have taken over what was previously a grassy field. Increased brownness could mean that plants reach their peak greenness earlier in the season and then go dormant faster than they used to.
Despite the fact that satellites show decreases in tundra vegetation greenness, a number of field-based studies report increased growth of tundra shrubs throughout the Arctic in recent years. The apparent contradiction, says report author Uma Bhatt, may reflect the difference in scale between satellite and ground observations. “The satellite is seeing the 12.5 km average, which includes the complete picture and mixes all of the vegetation,” Bhatt says. “The documentation of increased shrub cover is very localized. We are looking at two different things that to a great extent cannot be compared.”
To fully understand how Arctic vegetation is being affected by warming climate, scientists must use a combination of satellite observations, first-hand observations, and ecosystem models.
Map by Dan Pisut and NOAA Climate.gov, based on GIMMS NDVIg3 data provided by Uma Bhatt, University of Alaska-Fairbanks.
References
H. Epstein et al. (2015). Tundra Greenness. In Jeffries, M.O., Richter-Menge, J., Overland, J.E. (2015) Arctic Report Card: Update for 2015.
