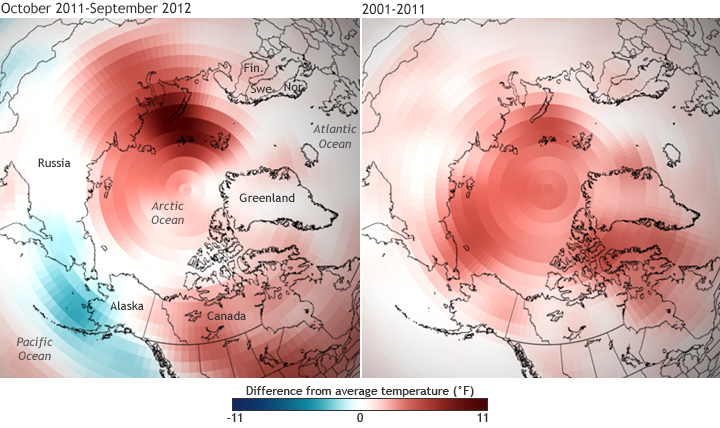
Arctic temperature patterns: 2012 and 2001-2011
Details
From snow and ice cover to the growth of ocean plant life, the Arctic is changing. At the root of these changes is the fact that Arctic surface temperatures have risen more than twice as much as temperatures at lower latitudes, a situation known as “Arctic amplification” of climate change.
The maps above show the difference from average temperatures in the Arctic for October 2011-September 2012 (left) as well as for the first decade of the 21st century (right). The annual map uses the most recent 30-year climatology (1981-2010) while the decadal average is compared to 1971-2000.
On a yearly basis, Arctic temperatures are strongly influenced by natural climate patterns, including the Arctic and North Atlantic Oscillations. In 2012, two pockets of unusually warm temperatures were located over north-central Russia and the high latitudes of North America, while the North Pacific was cooler than the long-term average. Over the span of a decade, though, Arctic amplification of climate change is evident: no part of the Arctic was cooler than the long-term average.
Read more about the Arctic atmosphere in Chapter 1, Section 1 of the 2012 Arctic Report Card.
Map based on NCEP Reanalysis data provided by the physical Sciences Division at NOAA ESRL.
