2013 Arctic Report Card: Surface melt on Greenland Ice Sheet back near average in 2013
Details
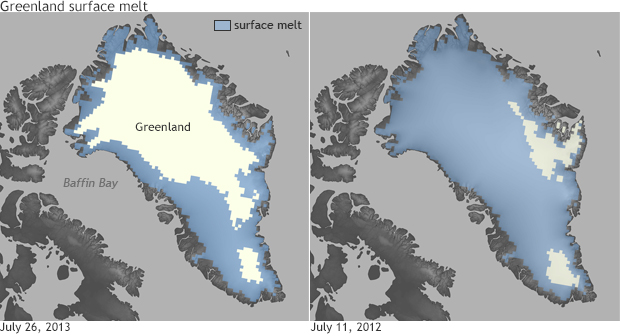
Most of the year, Greenland is almost completely covered by a massive ice sheet, but during the summer the sheet starts to melt as temperatures climb and sunlight hours lengthen. The amount of melting that occurs during a summer season is affected by a variety of factors including air temperature, wind patterns, and other meteorological conditions. After record-breaking melt during the 2012 season, the 2013 melt extent was more on par with the long-term average.
The maps compare the surface melt extent on the Greenland Ice Sheet at the summer peaks on July 26, 2013 (left) and July 11, 2012 (right). During the summer of 2013, the maximum area of melting on the Greenland ice sheet was 44 percent—the 14th highest in the 33-year record (1981-2013) and nowhere near the “extreme” 97 percent in 2012 (right). Both of these figures are snapshots of the days that saw the most melt during each summer. The average surface melt extent on a typical day during 2013 was roughly 17 percent, ranking 16th in the 30-year record and marking the lowest annual value since 1996. For comparison, the average daily melt extent during the record-breaking previous summer was 34 percent.
Overall, melt extent during the summer of 2013 did not deviate significantly from the averages seen from 1981 to 2010. Spikes in melting were more sporadic and much smaller in magnitude than those seen during the 2012 season. Melting occurred on more than 100 days in some locations along the ice sheet’s southwestern margin, which is on par with the long-term average. During 2013’s summer season, the frequency of melting along the ice sheet’s western and northwestern coasts was slightly higher than average, but the melting along the southern and southeastern coasts was less frequent than average.
Data recorded by automatic weather stations showed that surface air temperatures during the summer of 2013 were near the long-term average, even though the west coast of Greenland saw unusually warm temperatures during the spring. The west coast saw the warmest March on record since 1948 in 2013 at 13.9°F (7.7°C) above the 30-year baseline. Unlike the previous six summers, however, 2013 was characterized by a positive phase of the North Atlantic Oscillation, which diverted warm, southerly air masses eastward away from Greenland. The mean value of the oscillation was 0.88 during summer 2013, the highest such value since 1996’s 0.92. The weather pattern made way for a northerly airflow that promoted wetter and cloudier weather than normal in the western part of the country. Scientists attributed this oscillation as a potential reason for the drop in melting compared to last year.
More information can be found in the Greenland Ice Sheet chapter of the Arctic Report Card: Update for 2013.
Maps by NOAA climate.gov team, based on data provided by Thomas Mote, University of Georgia.
Related Links
New Record Temperature in Southwest Greenland?
