2011 Seasonal Temperature Anomalies
Details
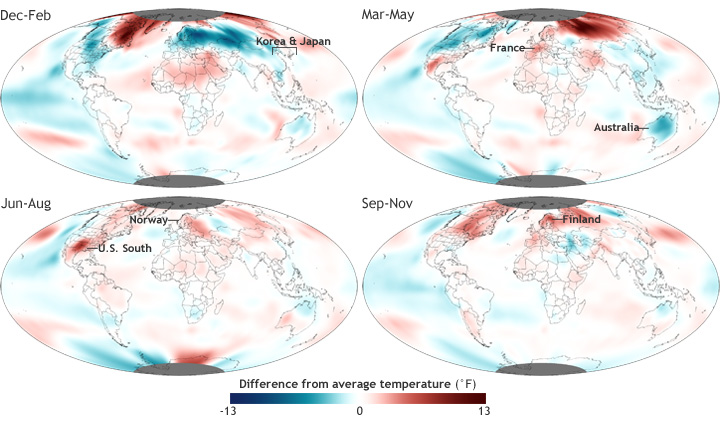
Seasonal temperature patterns displayed dramatic variability in 2011, with large differences from average temperature from place to place. Some areas experienced much cooler than average temperatures in one season followed by much warmer than average temperatures the next.
These maps show the difference from average seasonal temperatures in the Northern Hemisphere winter (December 2010-February 2011), spring (March-May), summer (June-August), and fall (September-November). Places cooler than the 1981-2010 average are blue, places where temperatures were near average are white, and places where temperatures were warmer than average are red.
The contiguous United States transitioned from a cooler-than-average winter to the second-warmest summer on record. Texas, Oklahoma, New Mexico, and Louisiana experienced their warmest summer in recorded history. In Europe, France and Spain had their warmest spring, and for Germany and Belgium it was second-warmest. Following a much cooler than average winter, the countries of northern Europe, including Norway, Sweden, and Finland, had unusually warm temperatures from spring through fall.
The maps also show the year-long influence of La Niña, a natural cooling of the eastern half of the tropical Pacific Ocean that occurs every few years or so. La Niña was stronger in the winter, with cool anomalies dominating the basin. La Niña weakened and faded during spring and summer, but returned in the fall.
Maps by Dan Pisut, NOAA’s Environmental Visualization Laboratory, based on Merged Land and Ocean Surface Temperature data from the National Climatic Data Center. Caption by Rebecca Lindsey. Reviewed by Jessica Blunden and Deke Arndt.
