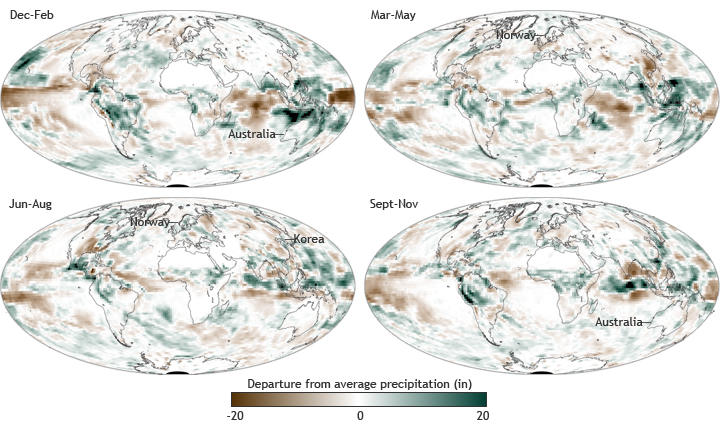
2011 Seasonal Precipitation Anomalies
Details
Seasonal precipitation patterns across the globe showed large differences from average, with several areas receiving heavy rains during more than one season of the La Niña-influenced year.
The map above shows the difference from average precipitation during the Northern Hemisphere winter (December 2010-February 2011), spring (March-May), summer (June-August), and fall (September-November). Shades of brown indicate areas that received up to 20 inches less than average precipitation while green indicates up to 20 inches more than average.
Norway reported its wettest year among records dating back to 1900: the country received 130 percent of average rainfall, breaking the previous record of 125 percent set in 1983. Spring and summer were very wet, with some parts of the country receiving up to 300 percent of their average rainfall for spring. It was Norway’s second wettest summer on record with much of the precipitation arriving during heavy rainfall events. From June 8-13, torrential rain combined with melting snow in Norway caused devastating floods resulting in landslides and houses and roads being washed away.
South Korea experienced its wettest summer since 1973 due to a continuous southwesterly flow of hot and humid air along the edge of the North Pacific High, which collided repeatedly with dry continental air over the Korean Peninsula. The persistent atmospheric instability contributed to heavy rainfall, floods, and landslides. On July 27, Seoul broke a record for heaviest single-day rainfall, with more than 12 inches.
Australia as a whole had its wettest spring, second-wettest summer, and third wettest year since records began in 1901. The early part of the year brought record-breaking rain to places farther east, including much of New South Wales and Victoria. The flooding rains during the first half of January caused numerous towns to be submerged across Queensland, and the extent of flooding was nearly the size of France and Germany combined.
Such soakings are more likely during La Niña events, in part because the persistent zone of showers and thunderstorms (the South Pacific Convergence Zone) that normally sits far off the northeast coast of Australia in the spring is pushed closer to land by La Niña’s stronger-than-usual easterly trade winds.
Maps based on monthly composites of precipitation data from the NCEP/NCAR Reanalysis project, provided by NOAA Earth System Research Laboratory.
