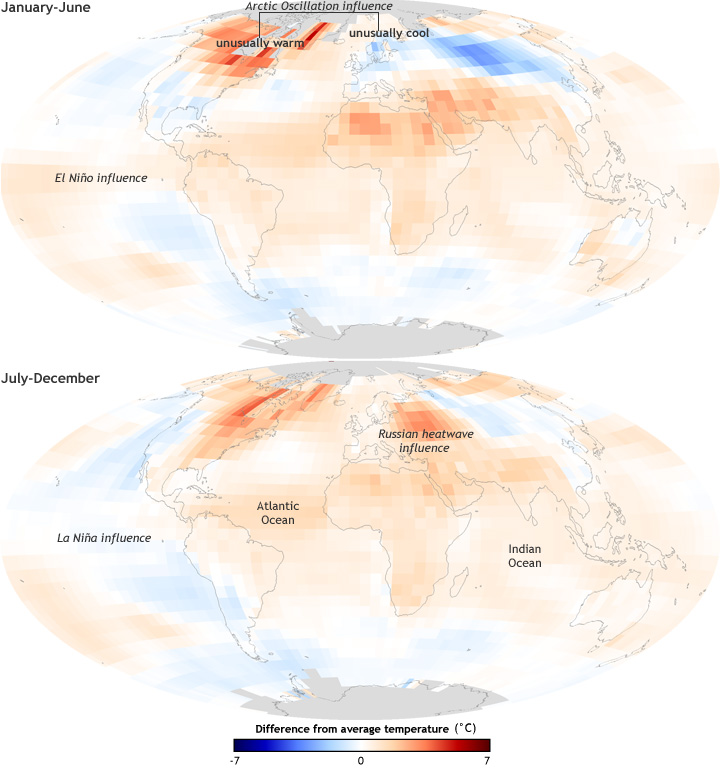
2010 Global Temps: January-June & July-December
Details
Averaged over the entire year, global temperatures in 2010 were among the two warmest years in the historical record. Two natural climate patterns, the Arctic Oscillation and the El Nño-Southern Oscillation, had strong influences on the patterns of unusually warm and unusually cool spots worldwide.
The first map shows where average surface temperatures were up to 7 degrees Celsius above (red), below (blue), or near (white) the long-term average (1971-2000) for the first half of 2010. The warming influence of an El Niño event in the tropical Pacific contributed to one of the two warmest January-June periods on record. The contrast between warmth in Canada and cool conditions across the North Atlantic is the influence of a strongly negative phase of the Arctic Oscillation.
The second map shows difference from average temperature for July-December 2010. Temperature anomalies are more muted as the influence of the Arctic Oscillation fades across high northern latitudes. Meanwhile shades of blue in the tropical Pacific indicate the emergence of a moderate-to-strong La Niña in the second half of the year. The heatwave in western Russia also left its mark on the July–December average temperatures.
Related Links:
Climate Patterns & 2010 Temperatures: Near-record Warmth, Strong Natural Variability
