File name: US_precip_drought_DJF_2018_620.gif
Original Resolution: 620 × 464
File Size: 223 KB (MIME Type: image/gif)
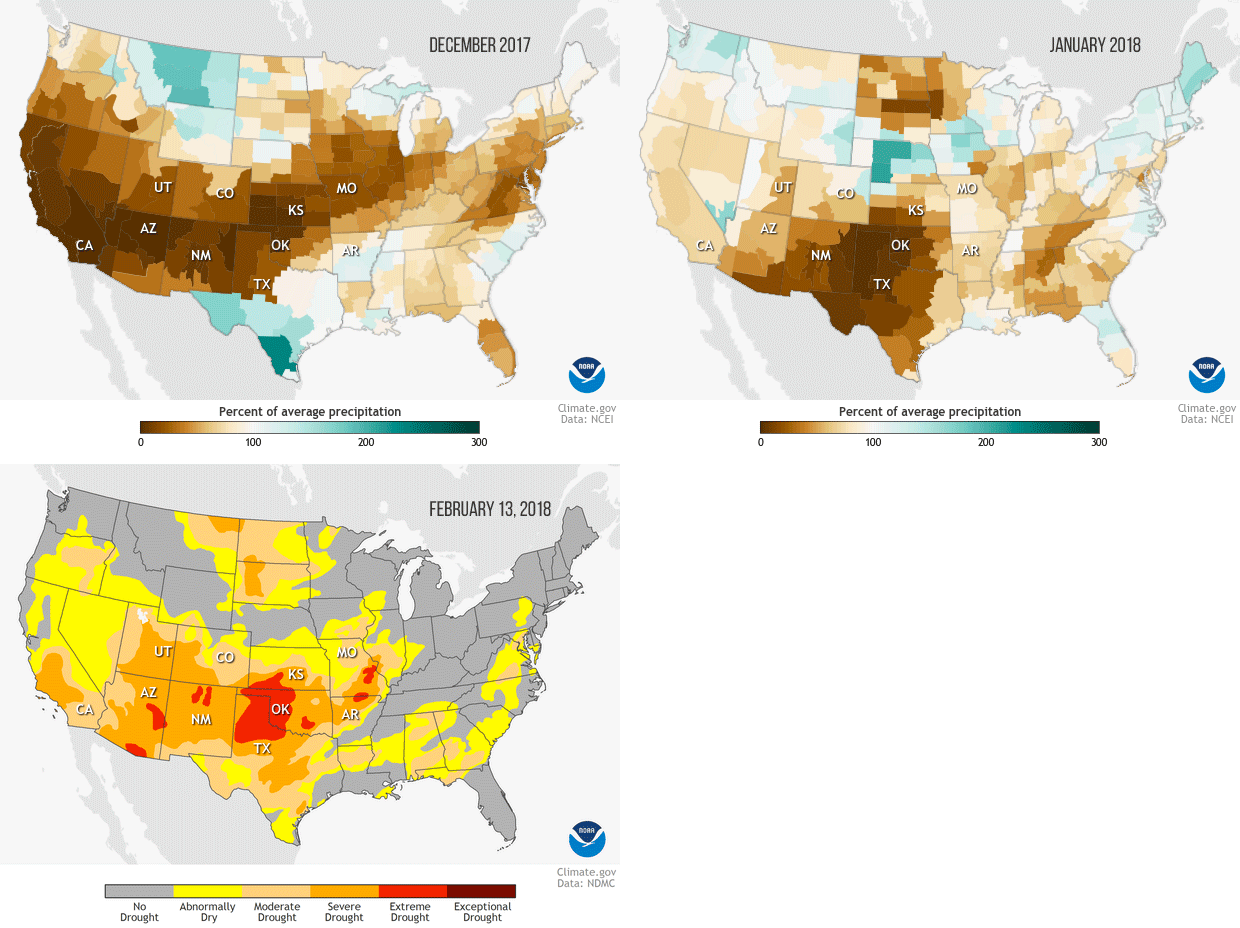
Animation of the percent of normal precipitation in December 2017 and January 2018 with the U.S. Drought Monitor map which was released on February 13, 2018. Locations where precipitation was less than 100 percent of the monthly average is in shades of brown. Places that received more than 100% of the monthly average precipitation is in shades of green. Precipitation deficits during the first two months of winter contributed to drought expansion across the United States. NOAA Climate.gov image based on data from Climate.gov Data Snapshots and the National Drought Monitor project.