File name: graph_map_barents_sea.png
Original Resolution: 620 × 870
File Size: 254 KB (MIME Type: image/png)
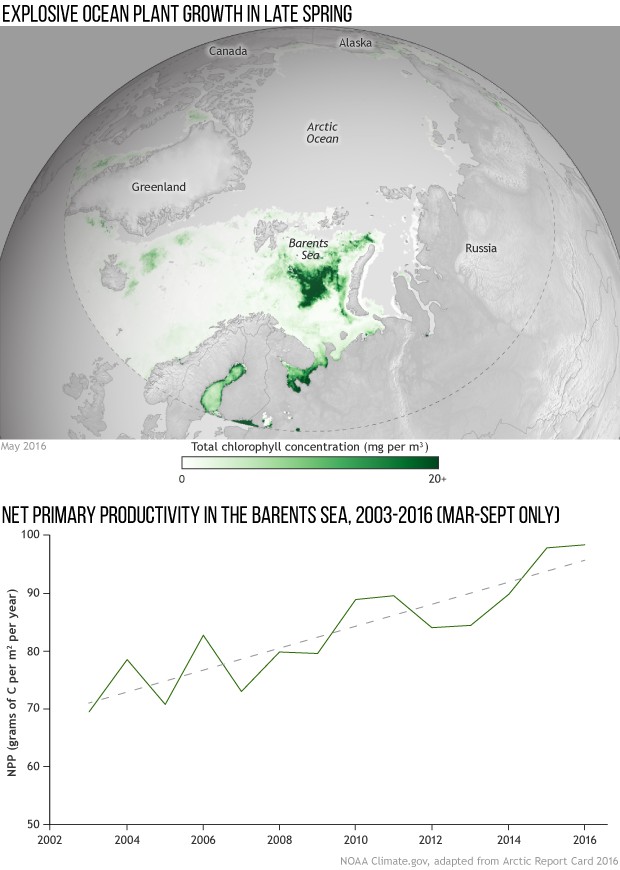
(map) Total chlorophyll concentration across the Arctic in May 2016. The darker the green, the higher the chlorophyll concentration. The light gray indicates areas where there was no data due to clouds or ice. In some areas, chlorophyll concentrations averaged more than 14 milligrams per cubic meter higher than the 2003-2015 mean. (graph) Net primary productivity (the net carbon gain or loss by growing plants) in the Barents Sea for March-September 2003-2016. NOAA Climate.gov map derived from NASA/MODIS-Aqua data. Graph adapted from Figure 6.4 in the 2016 Arctic Report Card.