File name: ARC2020_chlorophyl_and_seaice_620.jpg
Original Resolution: 621 × 402
File Size: 116 KB (MIME Type: image/jpeg)
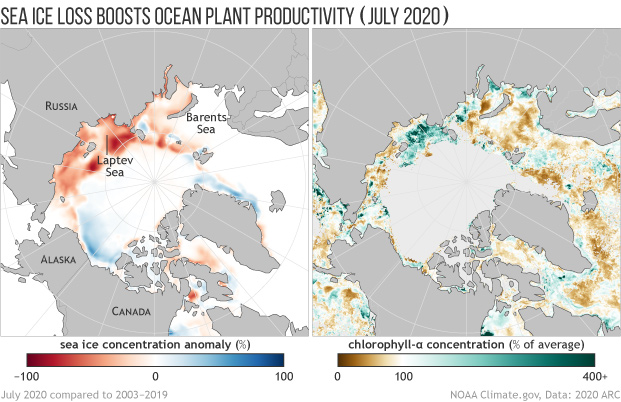
(left) Sea ice concentration in July 2020 compared to the 2003–2019 average. Red areas had up to 100% less than their average sea ice, while blue regions had up to 100% more ice than average. (right) Chlorophyll amounts—an indicator of ocean plant productivity—in July 2020 as a percent of the 2003–2019 average. Very low sea ice in the Laptev Sea in July was linked to much higher than average phytoplankton productivity (deep green). NOAA Climate.gov map by Mary Lindsey, adapted from the 2020 Arctic Report Card, based on data provided by Karen Frey.