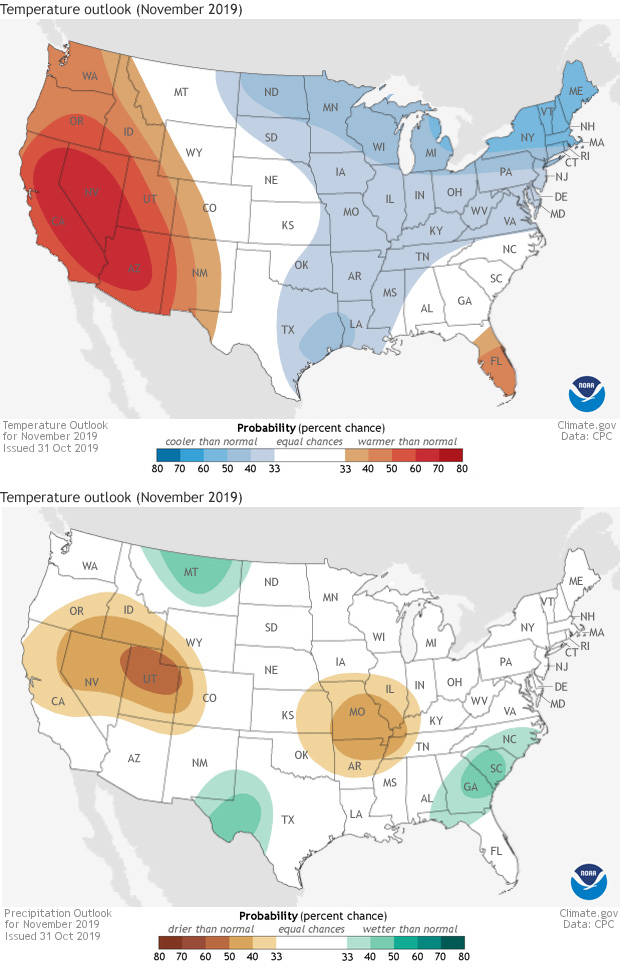
The temperature and precipitation outlooks for November 2019 issued October 31, 2019 by NOAA National Weather Service's Climate Prediction Center. (See here for a view
that includes Alaska and Hawaii). The colors on the maps indicate the most likely of the three outcomes. For the temperature outlook, darker reds refer to increasing likelihood of warmer-than-average temperatures, while darker blues refer to increasing odds of cooler-than-average temperatures. For precipitation, green areas show where the odds rise for wetter-than-average conditions, and browns show increasing odds for a drier-than-average month. Areas in white are places where the odds for all three categories—above, below and near-normal—are the same or have “equal chances” of occurring. NOAA Climate.gov image adapted from an image from the Climate Prediction Center.