The red line shows the combined heating influence of all long-lived greenhouse gases in Earth's atmosphere: carbon dioxide, methane, nitrous oxide, and CFCs and similar gases. In 2022, the index was 1.49—a 49 percent increase since 1990.
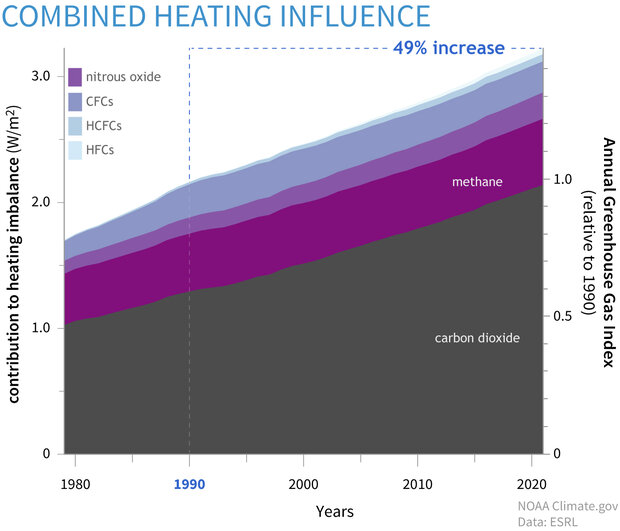
The colored shapes in this graph show how much each greenhouse gas contributes to the total energy imbalance in Earth’s atmosphere. Together, these gases trapped nearly 3.4 extra Watts of heat energy per square meter in 2022 compared to 1750.