Wondering which direction the wind was from during your last cold snap, or which summer months usually have a breeze?
For selected stations (mostly airports) where hourly wind speed and direction are recorded, registered users of MRCC's cli-MATE tools can select any time frame during a station’s period of record to analyze the wind speed and direction, including filtering specific dates or times of the day. There is no cost for registration.
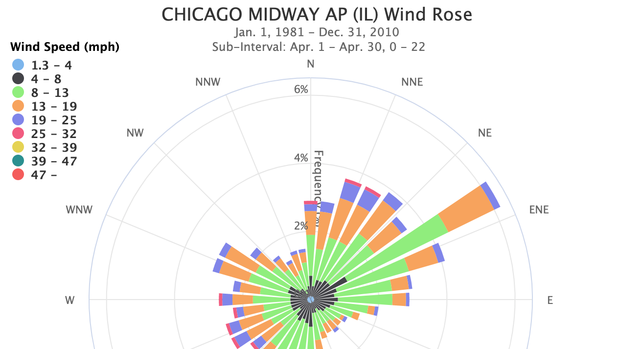
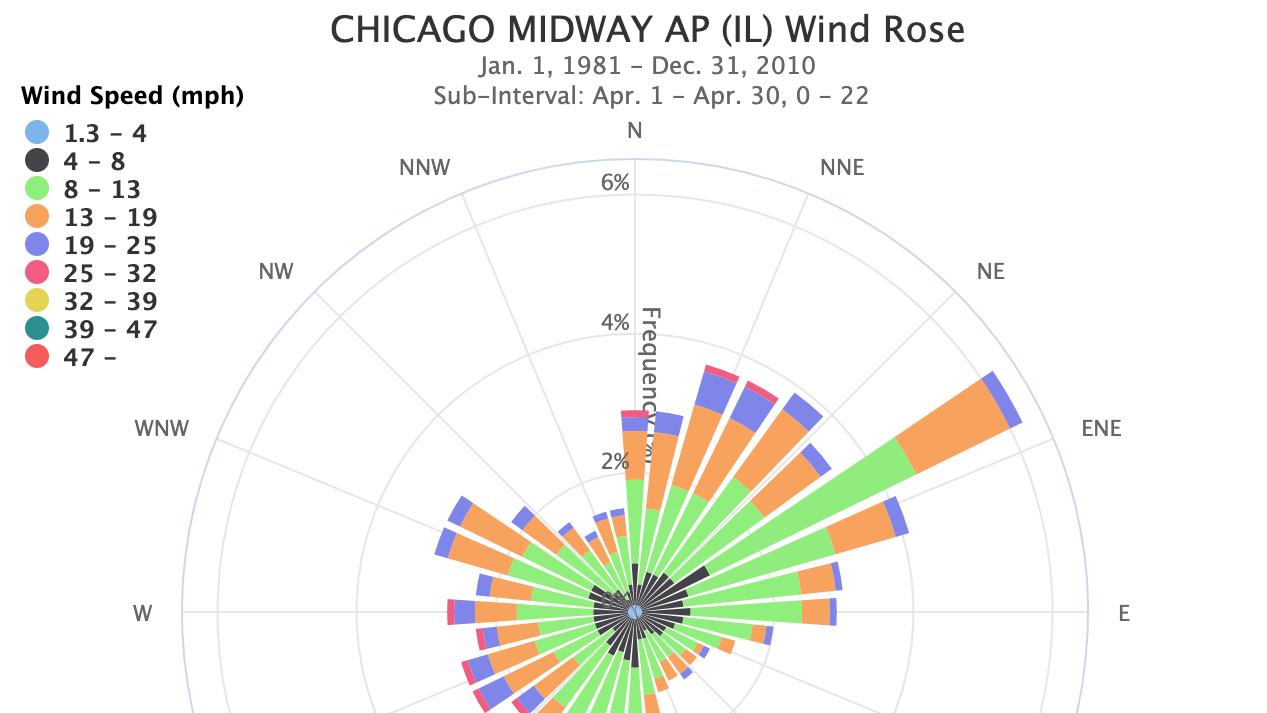
Wind roses are graphical charts that characterize the speed and direction of winds at a location. Presented in a circular format, the length of each "spoke" around the circle indicates the amount of time that the wind blows from a particular direction. Colors along the spokes indicate categories of wind speed.
Where do these data come from?
The Midwestern Regional Climate Center (MRCC) offers wind roses through its MRCC Application Tools Environment, called cli-MATE. Data are compiled and processed by the Climate Data Access Portal (Cli-DAP), which is maintained by the NOAA Regional Climate Centers (RCCs).
-
1) All users must register and log in for free access to cli-MATE.
Register for a cli-MATE account » (opens in a new tab).
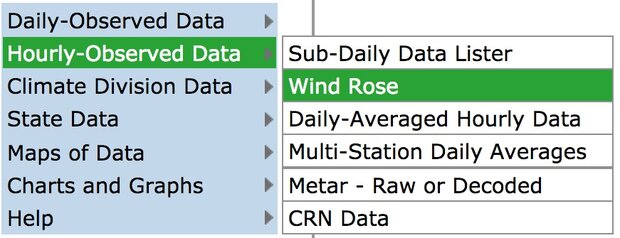
2) Once logged in to the cli-MATE site, roll your cursor over Hourly-Observed Data and click Wind Rose
3) Click Select Hourly Station at the top of the cli-MATE window to open the Hourly Station Selector. Use any of the options available to select a station of interest. Once selected, the name of the station will be listed under CURRENT HOURLY STATION INFORMATION at the top of the Wind Rose window.
For help with station selection, watch the Station Selection Video Tutorial
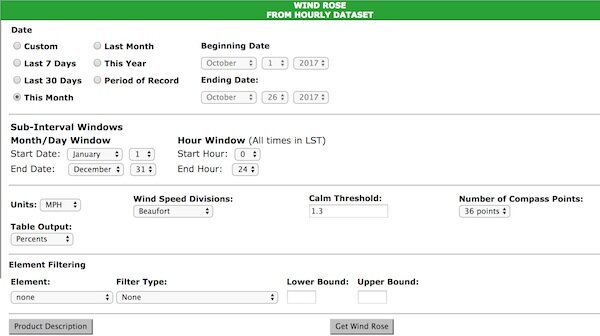
4) Use the drop-down menus and buttons to set the parameters for your wind rose.
- Choose one of the pre-defined periods by clicking its radio button, or enter a Beginning date and an Ending date.
- If you are interested in a specific portion of the record, set the sub-interval choices. For example, set the sub-interval drop downs to begin on April 1 and end on April 30 to produce a wind rose representing April winds during the period you selected. You could also set the times to check wind speed and direction for a specific portion of the day.
- Go with the default selections of units for wind speed and the number of compass points to display, or change them if you like.
- Go with the default selections for filtering at first. If you want to look for patterns such as which direction of wind is associated with rain or other conditions, explore these filters.
- Click Get Wind Rose.
-
Data Format(s)CSV, PDF, PNG, SVG
Access Type Link & Description Graphing Requires free registration. -
Monthly wind rose plots from 1961-1990 may serve as a point of comparison with more recent plots.
-
Data TypeLand-based stationEssential Climate VariablesWind speed and direction
Resolution
- Horizontal resolution(s)
-
- Point Resolution
- Temporal resolution(s)
-
- Hourly Climatology
Science OrganizationMidwest Regional Climate Center


 Click to see more detail
