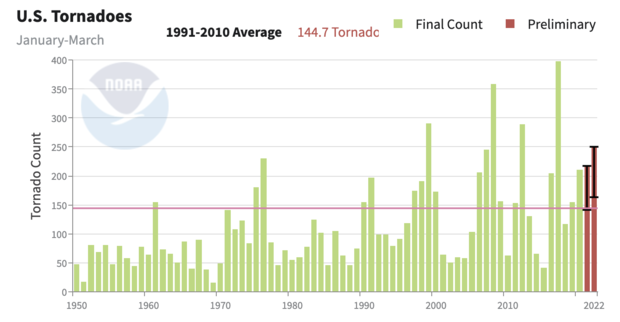
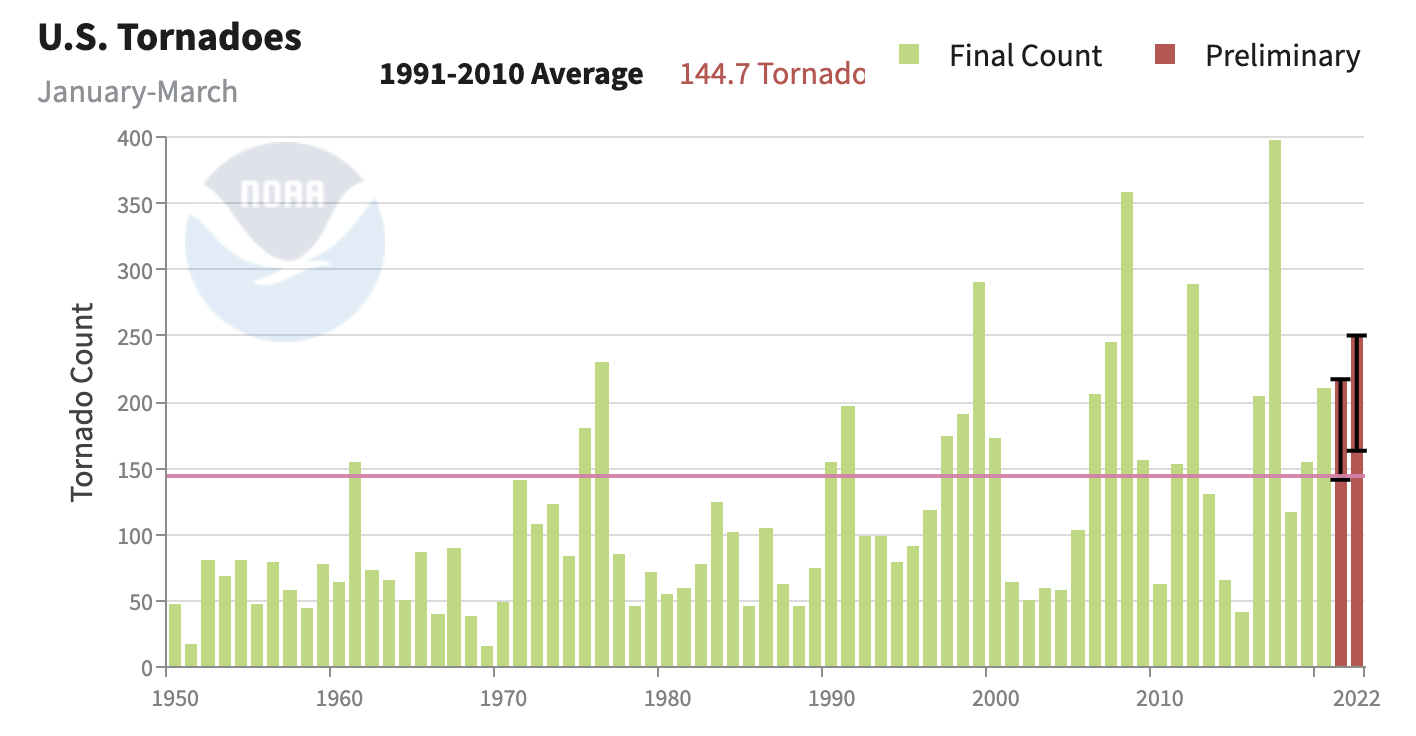
Tornadoes can occur anywhere, but they are more likely to develop in some locations (and during some months) than others. Graphs and map visualizations of the U.S. Tornadoes dataset lets you see when and where tornadoes have been spotted in the United States since 1950.
Where do these data come from?
Official counts of tornadoes come from NOAA's National Weather Service, specifically from the National Severe Storms Laboratory.
Storm spotters have been trained to recognize tornado conditions and report what they see. Many storm spotters work in emergency management positions, but anyone who has a keen interest in severe weather can look into the availability of storm spotter training at their local Weather Forecast Office. After completing the formal course, anyone can serve as an official storm spotters for their community.
During severe weather, meteorologists examine visualizations of Doppler radar data, watching for telltale patterns that may indicate a tornado. Special computer algorithms display the data in ways that make it easier for forecasters to identify potential tornadoes.
What can I do with these data?
Check the number of tornadoes recorded in the United States each month since January, 1950 » Drag the time slider below the graph to view earlier years. Do you notice any trends or long-term patterns in the number of tornadoes? Which month(s) have had the most tornadoes?
View maps showing the average number of tornadoes in each state per month » Click each monthly image to view a larger map. Check which years are represented by the maps. Which states have had the most tornadoes during January? Which states have seen the most tornadoes in July?
Explore the number and location of Billion-Dollar Weather and Climate Disasters in the United States since 1980 » Which type of disaster has incurred the highest costs? Which states have experienced the most and least weather and climate disasters?
-
Explore specific tornado outbreaks or seasons, including weather animations and reports of impacts and fatalities. Go to https://www.ncei.noaa.gov/access/monitoring/monthly-report/tornadoes/ and select a year and month (or season) of interest, then scroll down for additional information.
-
Data Format(s)CSV, PNG
-
Documentation Type Link & Description Interest -
The Severe Storms Prediction Center offers a range of charts and graphics.
-
Data TypeLand-based station, Severe weatherAncillary VariablesExtreme weatherScience OrganizationNOAA National Centers for Environmental Information
-
View the Storm Prediction Center's maps showing 25-Year Average Number of Tornadoes per State by Month (All tornadoes, 1989-2013)
 Click to see more detail
