Data Snapshots Image Gallery
Precipitation - Monthly Total
- Dataset Details
- Monthly images from 2000 to present
- Download Directories
- Click on any of the links below to view a directory listing of images and assets related to this dataset.
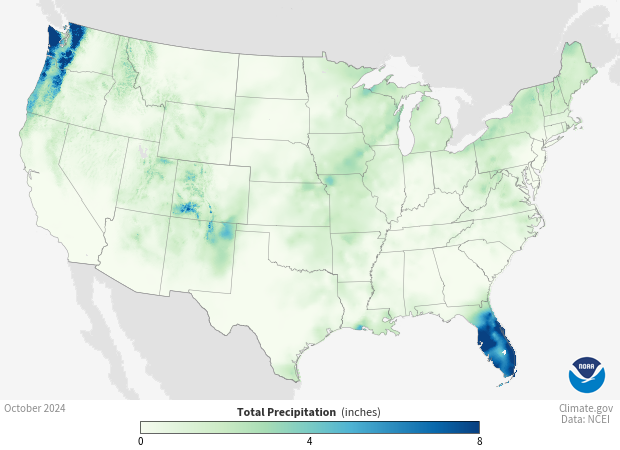
Colors show monthly precipitation totals across the contiguous United States. The darker the color, the higher the total precipitation.
Daily measurements of rain and snow come from weather stations in the Global Historical Climatology Network (GHCN-D). Volunteer observers or automated instruments gather the data and submit them to the National Centers for Environmental Information (NCEI). After scientists check the quality of the data to omit any systematic errors, they calculate each station’s monthly total precipitation and plot it on a 5x5 km gridded map. To fill in the grid at locations without stations, a computer program interpolates (or estimates) values, accounting for the distribution of stations and various physical relationships, such as the way temperature changes with elevation. The resulting product is the NOAA Monthly U.S. Climate Gridded Dataset (NClimGrid).
Areas shown in white received little or no measurable precipitation for the month. Areas shown in the lightest green received less than one inch of water from rain or snow. The darker the color on the map, the higher the precipitation for the month. Areas shown in dark blue received eight inches or more of precipitation that fell as either rain or snow. Note that snowfall totals are reported as the amount of liquid water they produce upon melting. Thus, a 10-inch snowfall that melts to produce one inch of liquid water would be counted as one inch of precipitation.
Farmers and gardeners who depend on rain for their plants want to know if enough precipitation has fallen to support plant growth. Similarly, forest managers and ranchers check monthly precipitation to monitor the status of the environment. Water managers who work to ensure that towns and cities have enough water for drinking, washing, and industrial uses are also interested in how much precipitation falls each month.
Data Snapshots are derivatives of existing data products; to meet the needs of a broad audience, we present the source data in a simplified visual style. This set of snapshots is based on climate data (NClimGrid) produced by and available from the National Centers for Environmental Information (NCEI). To produce our images, we invoke a set of scripts that access the source data and represent them according to our selected color ramps on our base maps.
NetCDF (Version: 4)
The data used in these snapshots can be downloaded from different places and in different formats. We used these specific data sources:
References
NOAA Monthly U.S. Climate Gridded Dataset (NClimGrid)
NOAA Monthly U.S. Climate Divisional Database (NClimDiv)
Improved Historical Temperature and Precipitation Time Series for U.S. Climate Divisions
NCEI Monthly National Analysis
Climate at a Glance - Data Information
NCEI Climate Monitoring - All Products
- Data Provider
- National Centers for Environmental Information (NCEI)
- Source Data Product
- NOAA Monthly U.S. Climate Gridded Dataset (NClimGrid)
- Access to Source Data
- NCEI direct HTTPS download
- Reviewer
- Chris Fenimore, National Centers for Environmental Information
